
- GBP/USD is trading higher for the third day in a row and is supported by a combination of factors.
- UK monthly GDP boosts sterling and benefits the pair amid modest dollar weakness.
- The mixed technical setup warrants some caution on the part of the bulls ahead of the key US NFP report.
The pair GBP/USD extends this week’s bounce from the 1.1800 level, or its lowest level since November 2022, and gains some continuation traction for the third day in a row on Friday. The momentum lifts the pair to a three-day high during the first half of the European session, with bulls now expecting sustained strength above the psychological 1.2000 level before opening new positions.
The British pound gets a boost on the last day of the week, after the monthly UK GDP report showed the economy expanded by 0.3% in January. The reading beat market expectations for 0.1% growth and signals a strong rebound after December’s 0.5% contraction. Besides, US dollar remains on the defensive as expectations of a 50 basis point rate hike at the March FOMC meeting wanewhich in turn provides additional support for the GBP/USD pair.
Having said that, the prevailing risk aversion sentiment in global stock marketsin a context of risk of a recession, Helps Limit Safe Haven USD Losses. Traders also seem reluctant to open aggressive positions, preferring to wait on the sidelines for the US NFP report, due to be released at the start of the American session. This, in turn, could keep any further bullish moves for GBP/USD at bay, at least for now.
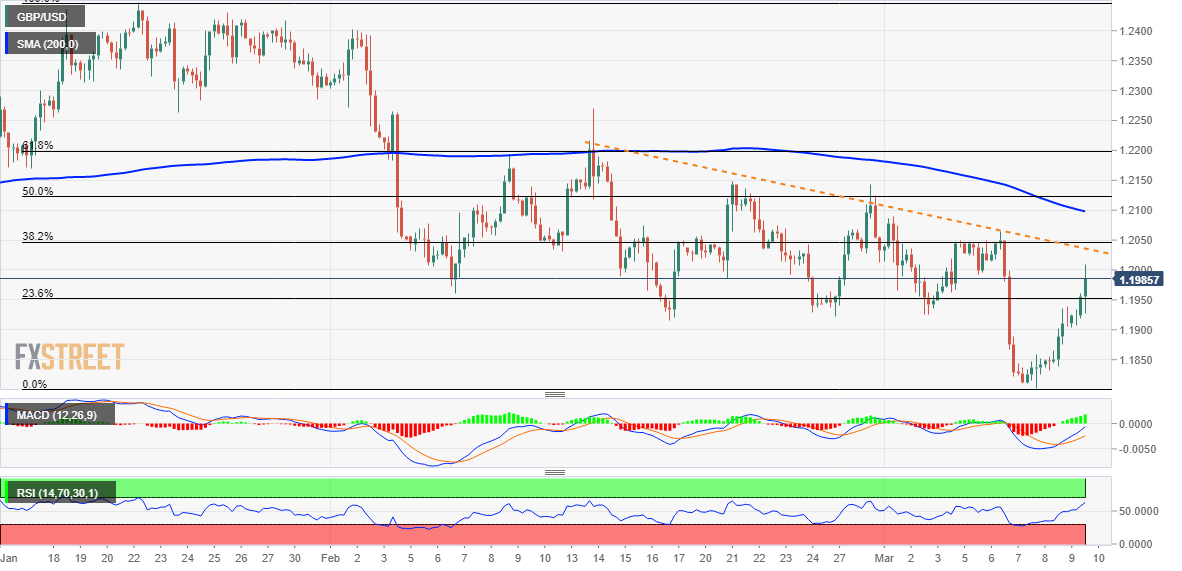
From a technical perspective, the intraday positive move lifts the pair above the 23.6% Fibonacci retracement of the recent corrective decline from the vicinity of the 1.2450 zone, or a multi-month high hit in January. Additionally, oscillators on the 4-hour chart have been gaining strong positive traction. This, in turn, supports the prospects for an extension of the bullish move towards testing the 38.2% Fibonacci which coincides with the resistance zone of 1.2050-1.2060.
That being said, the technical indicators on the daily chart, although they have recovered, still do not confirm a bullish outlook. On the other hand, the Relative Strength Index (RSI) on the 1 hour chart is showing overbought conditions and warrants some caution for bulls ahead of the key data.
On the other hand, the 23.6% Fibonacci, around 1.1950, seems to defend the immediate fall. The next relevant support is near the technically significant 200 SMA and currently around the round 1.1900. A convincing break below this level would shift the short-term bias back in favor of the bears and make GBP/USD vulnerable to accelerate the decline towards the level of 1.1800.
GBP/USD 4-hour chart
GBP/USD technical levels to watch
Source: Fx Street
I am Joshua Winder, a senior-level journalist and editor at World Stock Market. I specialize in covering news related to the stock market and economic trends. With more than 8 years of experience in this field, I have become an expert in financial reporting.


