
- GBP/USD rises more than 0.65% after disappointing US economic numbers
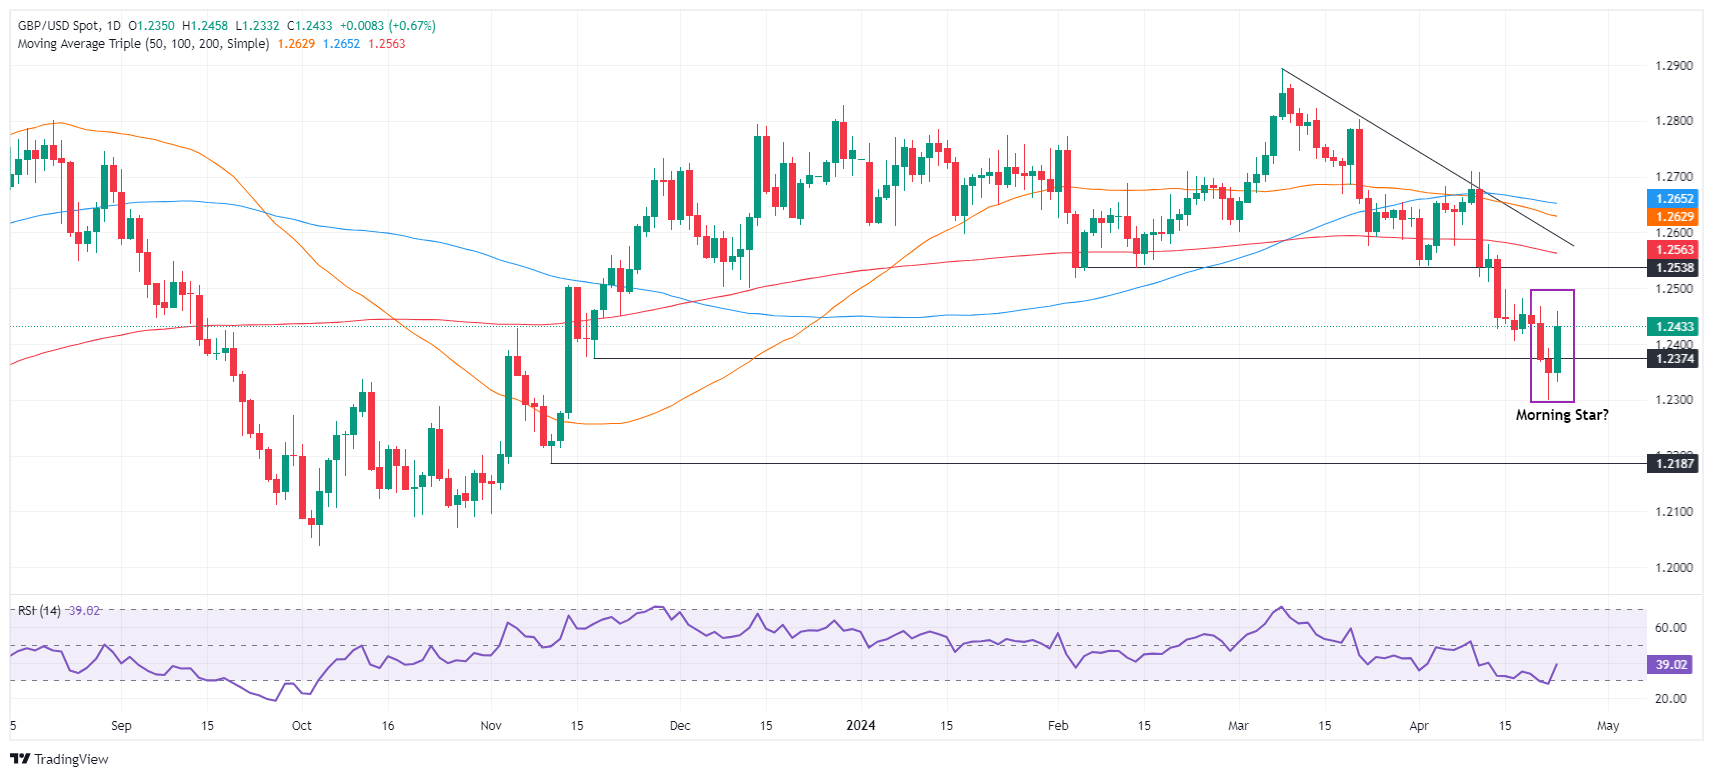
- Technical analysis indicates a possible move higher if GBP/USD maintains a close near 1.2440, completing a “morning star” pattern.
- Key resistances are at 1.2500 and the 200-day moving average at 1.2565; downside risks persist below 1.2400.
The British pound rallied in the early stages of the North American session, gaining more than 0.65% against the US dollar, after weaker-than-expected US data, which could prompt the Federal Reserve to start relax its monetary policy sooner than planned. The GBP/USD pair is trading at 1.2434, after bouncing off lows reached at 1.2331.
GBP/USD Price Analysis: Technical Outlook
From a technical point of view, GBP/USD remains biased to the downside as key resistance levels continue to be respected by price action. However, if the pair manages a daily close around the 1.2440 area, a “morning star” candlestick chart pattern will be completed, suggesting that the pair could head higher.
In that case, the first resistance for GBP/USD would be the psychological level of 1.2500. Once surpassed, further rises are expected, with the 200-day moving average (DMA) next at 1.2565, ahead of 1.2600. Key resistance levels are the 50-day moving average at 1.2628 and the 100-day moving average at 1.2649.
On the other hand, if the pair falls below 1.2400, more losses will occur. Breaking this last level would pave the way to challenge the yearly low of 1.2299.
GBP/USD Price Action – Daily Chart
Source: Fx Street
I am Joshua Winder, a senior-level journalist and editor at World Stock Market. I specialize in covering news related to the stock market and economic trends. With more than 8 years of experience in this field, I have become an expert in financial reporting.


