
- GBP/USD moves lower on Thursday, breaking a three-day winning streak to the weekly high.
- USD finds support in rising US bond yields and puts pressure on the pair.
- The decline lacks follow-through as traders wait for the BoE before opening new directional positions.
The GBP/USD pair trades with a slightly negative bias at the start of the European session on Thursday and moves further away from the weekly high, around the 1.2740 area touched the previous day. However, the pair remains above the 1.2700 level, as traders await the crucial monetary policy decision from the Bank of England (BoE) before opening new directional positions.
Ahead of the central bank risk event, the US Dollar (USD) attracts some buyers following a good rally in US Treasury yields, which turns out to be a key factor acting as a wind against for the GBP/USD pair. However, expectations that the Federal Reserve (Fed) will cut interest rates twice this year limit any significant gains for the dollar. Additionally, reduced bets that the BoE will ease monetary policy in the coming months, following higher-than-expected service sector inflation in May, should support the British Pound (GBP) and lend support to the pair.
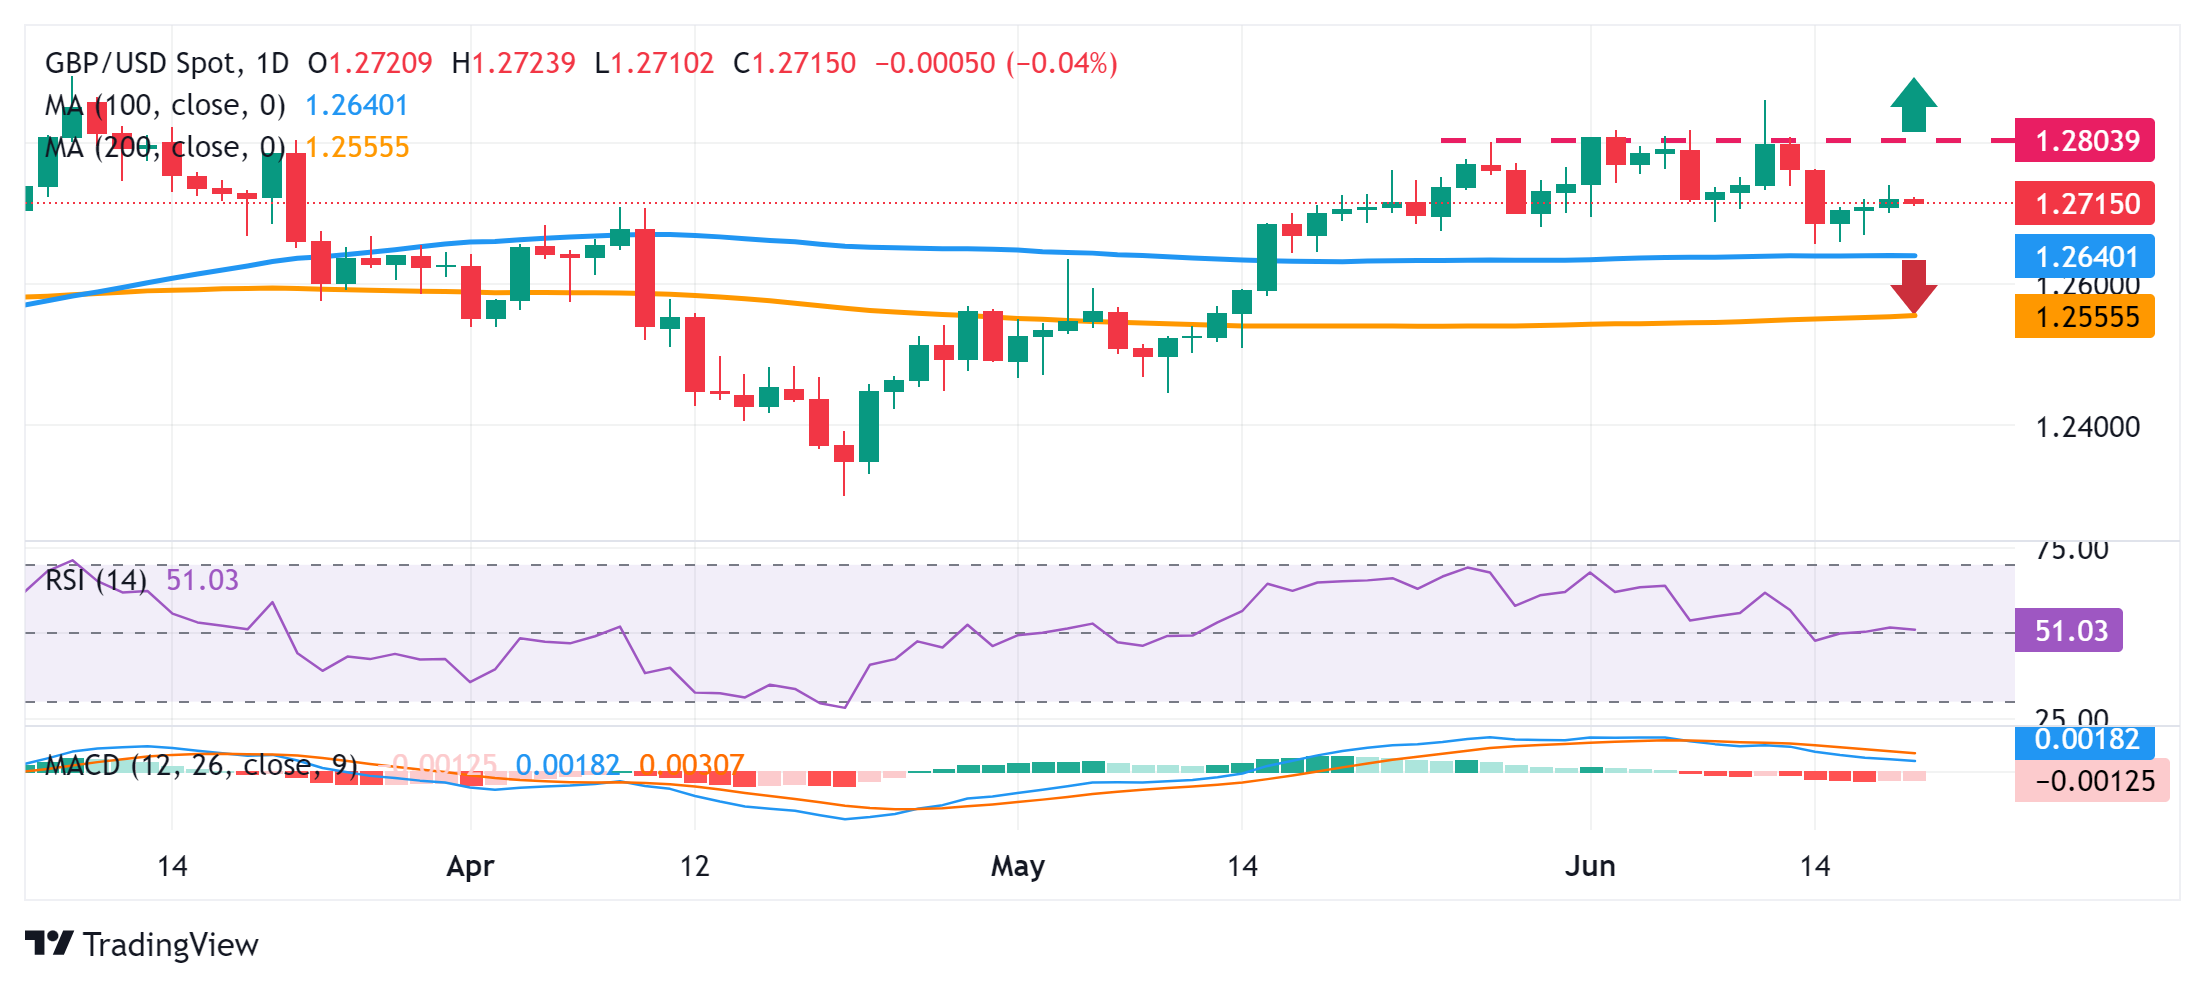
From a technical perspective, GBP/USD remains comfortably above the 100- and 200-day SMA, favoring bullish traders. That said, the mixed oscillators on the daily chart and the recent repeated failures to find acceptance above the round 1.2800 level warrant some caution before positioning for any significant upside ahead of the UK national election on July 4. However, any further decline will likely find decent support near the 1.2755-1.2750 horizontal zone, below which the pair could accelerate the decline towards the 1.2715-1.2710 region.
Some follow-through selling below the 1.2690-1.2685 region will suggest that the recent strong rally from the yearly low hit in April has come to an end and will expose support at the 100-day SMA, currently situated near the 1.2640 area. -1.2635. The GBP/USD pair could eventually weaken further below the 1.2600 level and aim to challenge the very important 200-day SMA, around the 1.2560-1.2555 area.
On the upside, bulls need to wait for sustained strength above the 1.2800 level before positioning for a move back towards the more than three-month high, around the 1.2860 area touched last Wednesday. The subsequent move higher should allow the GBP/USD pair to surpass the yearly peak, around the 1.2900 neighborhood, and rise further towards the 1.2950 hurdle before aiming to reclaim the psychological level of 1.3000 for the first time since July 2023. .
GBP/USD daily chart
Source: Fx Street
I am Joshua Winder, a senior-level journalist and editor at World Stock Market. I specialize in covering news related to the stock market and economic trends. With more than 8 years of experience in this field, I have become an expert in financial reporting.


")


