
- GBP/USD is down 0.27%, influenced by US inflation data suggesting the Federal Reserve could delay rate cuts.
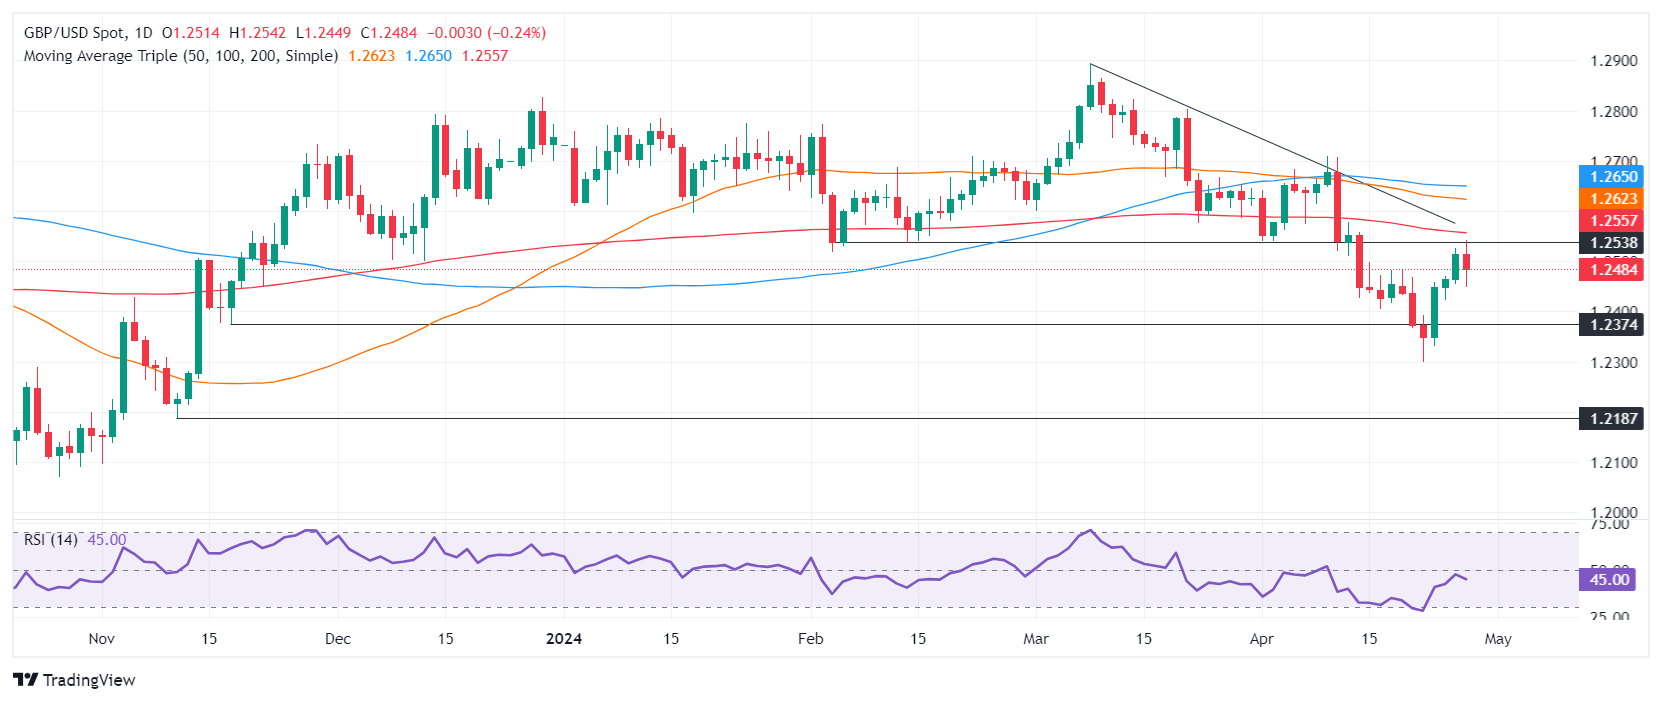
- The pair's recent inability to break the 200-day moving average at 1.2557 highlights its bearish bias, with support levels now in focus.
- Chances of further losses if the “dark cloud” candlestick pattern forms, targeting 1.2400 and likely extending to the yearly low of 1.2300.
In the middle of the North American session, the British Pound retreats and registers losses against the US Dollar, falling below 1.2500. US data showed a pick-up in inflation, which would deter the Fed from cutting interest rates. The GBP/USD pair is trading at 1.2481, down 0.27%.
GBP/USD Price Analysis: Technical Insights
Although GBP/USD closed three days of consecutive gains, it remains biased lower as buyers failed to break the resistance of the 200-day moving average (DMA) at 1.2557. That exposed the 1.2500 figure, which was yielded by fundamental news.
If GBP/USD ends Friday's session around 1.2480, a “dark cloud” will form, opening the door to further losses. The next support would be 1.2400, followed by the yearly high at 1.2300.
On the other hand, if buyers lift the pair above 1.2500, it would open the door to challenge the 200 DMA.
GBP/USD Price Action – Daily Chart
Source: Fx Street
I am Joshua Winder, a senior-level journalist and editor at World Stock Market. I specialize in covering news related to the stock market and economic trends. With more than 8 years of experience in this field, I have become an expert in financial reporting.


