
- GBP/USD could continue to lose ground as the 14-day RSI hints at an imminent correction.
- The pair could test the psychological resistance at the level of 1.3000.
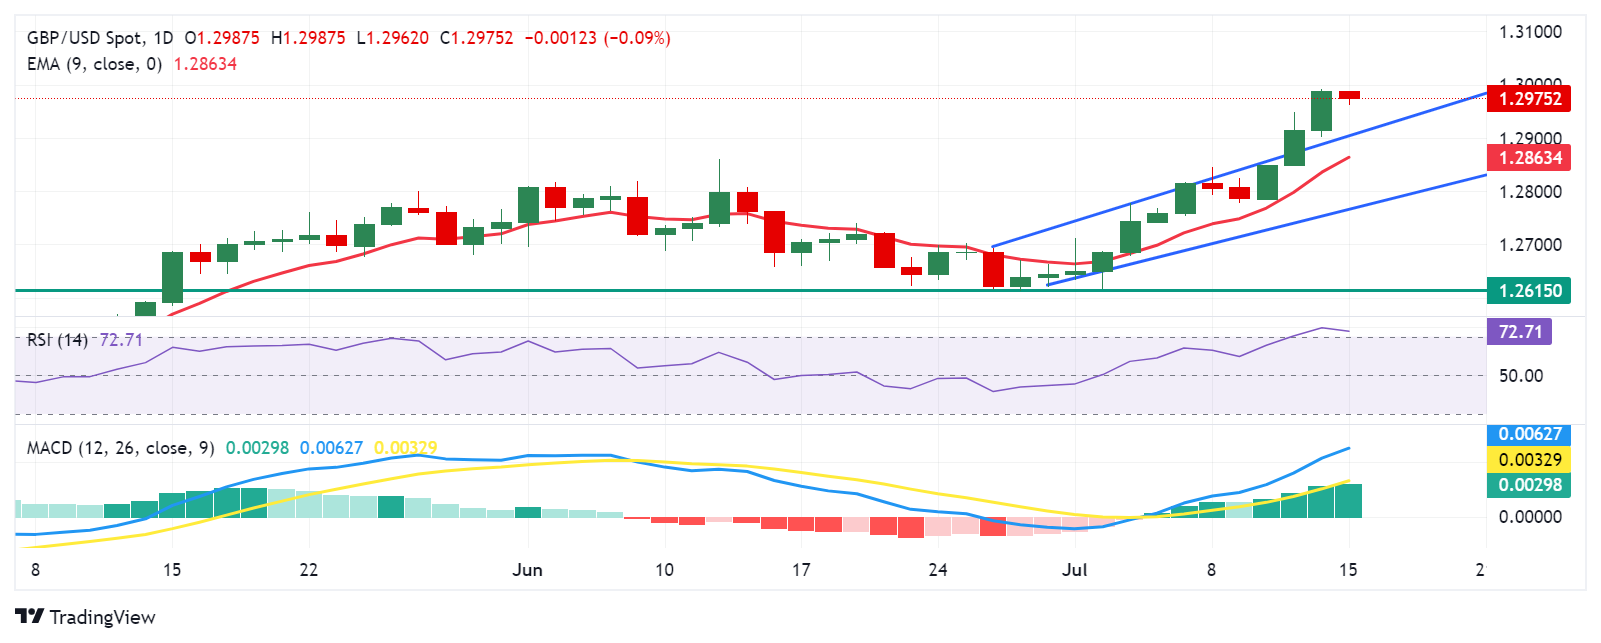
- Immediate support is anticipated near the upper boundary of the ascending channel, around the 1.2900 level.
GBP/USD is marginally lower, hovering around 1.2970 in Monday’s Asian session after pulling back from Friday’s peak of 1.2990, the highest since July 2023. The daily chart analysis shows a break above an ascending channel, signaling an uptrend in the pair’s price movements.
Additionally, the Moving Average Convergence/Divergence (MACD) indicator is reflecting short-term bullish momentum, with the MACD line above the center line and positively diverging from the signal line.
However, the 14-day Relative Strength Index (RSI) is hovering slightly above the 70 level, confirming the bullish trend while also suggesting possible overbought conditions. A possible drop could indicate a weakening of the bullish sentiment, possibly hinting at an imminent correction.
In terms of resistance, the GBP/USD pair could test the psychological level of 1.3000. A break above this level could provide support for the pair to explore the region around the key level of 1.3100.
On the downside, immediate support appears around the upper boundary of the ascending channel at the level of 1.2900. A return to the ascending channel could help the pair reach the nine-day exponential moving average (EMA) at 1.2863.
A break below the nine-day EMA could lead the GBP/USD pair to test the lower boundary of the ascending channel at the level of 1.2770. Additional support could be found around the retracement support level of 1.2615.
GBP/USD: Daily Chart
Pound Sterling PRICE Today
The table below shows the exchange rate of the British Pound (GBP) against major currencies today. The British Pound was the weakest currency against the US Dollar.
| USD | EUR | GBP | JPY | CAD | AUD | NZD | CHF | |
|---|---|---|---|---|---|---|---|---|
| USD | 0.12% | 0.09% | -0.11% | 0.09% | 0.15% | 0.14% | 0.14% | |
| EUR | -0.12% | 0.00% | -0.02% | 0.17% | 0.06% | 0.24% | 0.21% | |
| GBP | -0.09% | -0.01% | 0.06% | 0.17% | 0.05% | 0.17% | 0.20% | |
| JPY | 0.11% | 0.02% | -0.06% | 0.21% | 0.04% | 0.21% | 0.06% | |
| CAD | -0.09% | -0.17% | -0.17% | -0.21% | -0.02% | 0.03% | 0.03% | |
| AUD | -0.15% | -0.06% | -0.05% | -0.04% | 0.02% | 0.15% | 0.15% | |
| NZD | -0.14% | -0.24% | -0.17% | -0.21% | -0.03% | -0.15% | -0.01% | |
| CHF | -0.14% | -0.21% | -0.20% | -0.06% | -0.03% | -0.15% | 0.01% |
The heatmap shows percentage changes of major currencies. The base currency is selected from the left column, while the quote currency is selected from the top row. For example, if you choose the British Pound from the left column and move along the horizontal line to the US Dollar, the percentage change shown in the chart will represent the GBP (base)/USD (quote).
Source: Fx Street
I am Joshua Winder, a senior-level journalist and editor at World Stock Market. I specialize in covering news related to the stock market and economic trends. With more than 8 years of experience in this field, I have become an expert in financial reporting.


