
- GBP/USD drops to 1.2881, marking the third day of losses, after hitting a high of 1.2913.
- Sellers’ momentum is strong as the RSI is falling, suggesting further downside potential.
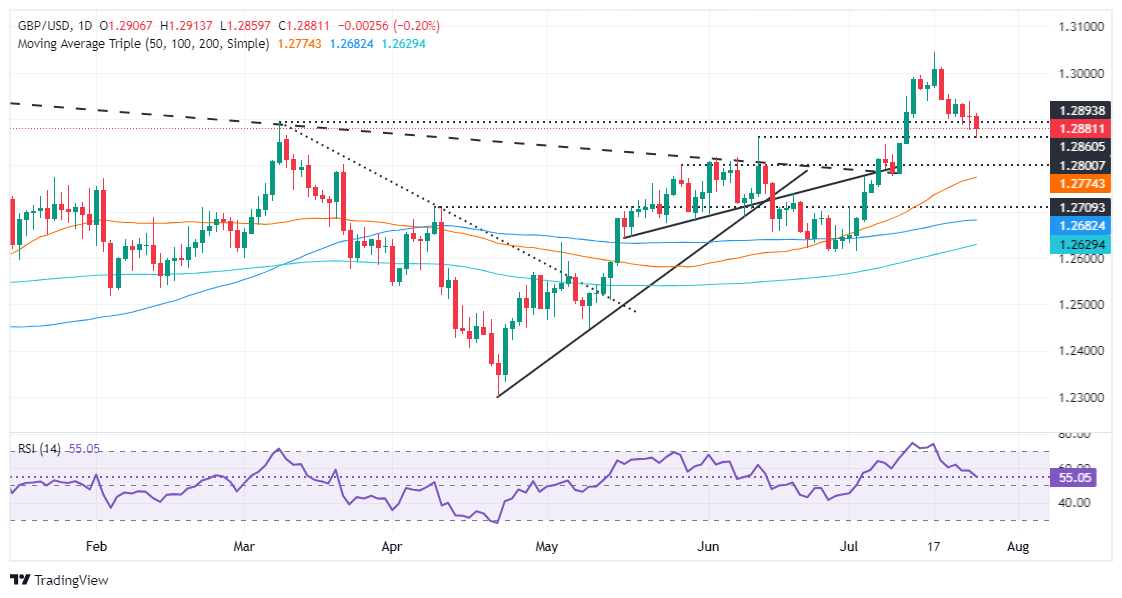
- Key supports at 1.2860; below targets 1.2800, 50-day SMA at 1.2773. Resistance at 1.2940 critical for a bullish turnaround.
The British Pound fell below 1.2900 for the third consecutive day, down 0.17% and trading at 1.2881 after hitting a daily high of 1.2913. UK data was no better than expected, while an outstanding US growth report boosted the Dollar.
GBP/USD Price Analysis: Technical Outlook
From a technical perspective, GBP/USD continues to decline, although sellers are finding it difficult to overcome the June 12 peak at 1.2860, which turned into support once cleared.
Momentum remains on the sellers’ side, however, as the RSI extends its decline after exiting overbought territory, approaching the neutral 50 line.
For a bullish continuation, GBP/USD needs to reclaim 1.2900. This would pave the way for remaining range-bound within the 1.2900-1.2940 area unless the latter is broken, exposing the 1.3000 figure. Further upside potential is seen above that level, with the yearly high at 1.3043.
On the downside, and the path of least resistance in the short term, the first support for GBP/USD would be 1.2860. Once overcome, the next target would be 1.2800, followed by the 50-day moving average (DMA) at 1.2773.
GBP/USD Price Action – Daily Chart
Pound Sterling PRICE Today
The table below shows the exchange rate of the British Pound (GBP) against major currencies today. The British Pound was the strongest currency against the New Zealand Dollar.
| USD | EUR | GBP | JPY | CAD | AUD | NZD | CHF | |
|---|---|---|---|---|---|---|---|---|
| USD | -0.18% | 0.19% | 0.00% | 0.10% | 0.46% | 0.49% | -0.57% | |
| EUR | 0.18% | 0.38% | 0.18% | 0.29% | 0.65% | 0.68% | -0.41% | |
| GBP | -0.19% | -0.38% | -0.18% | -0.07% | 0.28% | 0.29% | -0.78% | |
| JPY | 0.00% | -0.18% | 0.18% | 0.11% | 0.47% | 0.47% | -0.58% | |
| CAD | -0.10% | -0.29% | 0.07% | -0.11% | 0.36% | 0.38% | -0.69% | |
| AUD | -0.46% | -0.65% | -0.28% | -0.47% | -0.36% | 0.04% | -1.05% | |
| NZD | -0.49% | -0.68% | -0.29% | -0.47% | -0.38% | -0.04% | -1.08% | |
| CHF | 0.57% | 0.41% | 0.78% | 0.58% | 0.69% | 1.05% | 1.08% |
The heatmap shows percentage changes of major currencies. The base currency is selected from the left column, while the quote currency is selected from the top row. For example, if you choose the British Pound from the left column and move along the horizontal line to the US Dollar, the percentage change shown in the chart will represent the GBP (base)/USD (quote).
Source: Fx Street
I am Joshua Winder, a senior-level journalist and editor at World Stock Market. I specialize in covering news related to the stock market and economic trends. With more than 8 years of experience in this field, I have become an expert in financial reporting.


