
- The pound trims part of Monday’s gains and pulls back towards the 1.2530 area.
- Risk aversion and weaker than expected UK PMIs weighed on GBP/USD.
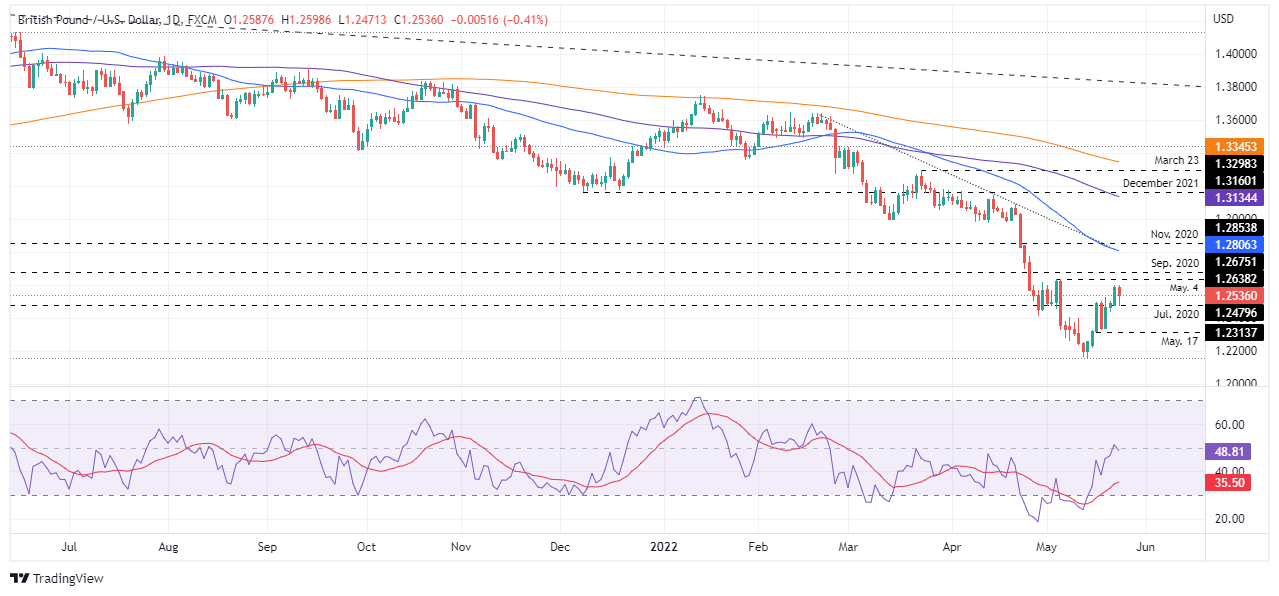
- GBP/USD Price Forecast: A daily close below 1.2600 to leave the major exposed to additional selling pressure.
Sterling went on the defensive as sentiment turned sour weighed down by weaker-than-expected UK PMIs, which dragged the major from weekly highs around 1.2600 towards the 1.2530 area. At 1.2536, the GBP/USD is paring some of Monday’s gains and is down 0.40%.
The mood remains subdued, fueled by concerns that the US economy is slipping into recession. The Federal Reserve is in a hike cycle, tightening its monetary policy, which according to money market futures, would see the Fed hike towards the 2.75-3% zone by the end of the year.
Another factor that is weighing is the Covid-19 crisis in China. Weekend reports illustrate that Beijing is struggling to limit the spread. Meanwhile, in Shanghai, which was about to lift restrictions, a new outbreak occurred, although not like at the beginning of the last episode.
On the other hand, GBP/USD opened near the daily high around 1.2600, but fell and broke below the central and S1 daily pivot points near 1.2480. However, towards the end of the European session, the major currency is making a strong move and is heading towards the 50-hour Simple Moving Average (SMA) at 1.2542.
GBP/USD Price Forecast Technical Outlook
From a technical point of view, the GBP/USD continues to have a bearish bias, despite having bounced 300 pips from the low of the year to current levels. The 1.2600 level appears to be solid resistance as GBP/USD bulls struggled twice to recapture the figure, which would have opened the door for a move higher towards the May 4 high at 1.2638. However, a daily close below 1.2600 would leave the pair vulnerable to additional selling pressure, further validated by the RSI at 48.69, within negative territory and heading lower.
That said, the first GBP/USD support would be the psychological figure at 1.2500. A break of the latter would expose the July 2020 lows near 1.2479, followed by the May 17 daily low at 1.2313 and the YoY low at 1.2155.
Technical levels
Source: Fx Street
With 6 years of experience, I bring to the table captivating and informative writing in the world news category. My expertise covers a range of industries, including tourism, technology, forex and stocks. From brief social media posts to in-depth articles, I am dedicated to creating compelling content for various platforms.


