
- GBP/USD steady as worse-than-expected US consumer confidence report weighs on US dollar.
- The technical outlook shows a ‘bullish breakthrough’ pattern, but momentum favors sellers, with the RSI in bearish territory.
- Key support levels will be the 100-day moving average and the May 3 high at 1.2640/34, with further losses expected below the psychological level of 1.2600.
- Key resistance levels are 1.2700 and the previous support-turned-resistance trend line at 1.2730/40.
The British Pound held firm against the Dollar on Tuesday, although the latter remained positive, and a worse-than-expected consumer confidence report limited the US Dollar’s advance. Therefore, GBP/USD is trading at 1.2678, virtually unchanged.
GBP/USD Price Analysis: Technical Perspective
The pair formed a ‘bullish breakout’ pattern, suggesting that traders could challenge the next resistance seen at 1.2700, although buyers remain reluctant to take GBP/USD towards that level.
Momentum still favors sellers, as shown by the RSI, which remains bearish and points lower. That said, GBP/USD’s path of least resistance is down.
The first support will be the confluence of the 100-day moving average (DMA) and the May 3 high-turned-support around 1.2640/34, closely followed by the 50-day moving average at 1.2632. Once above that area, the key psychological level 1.2600 would be next, before the 200-day moving average at 1.2555.
For a bullish continuation, traders must reclaim 1.2700 and break above a previous support-turned-resistance trend line around 1.2730/40.
GBP/USD Price Action – Daily Chart
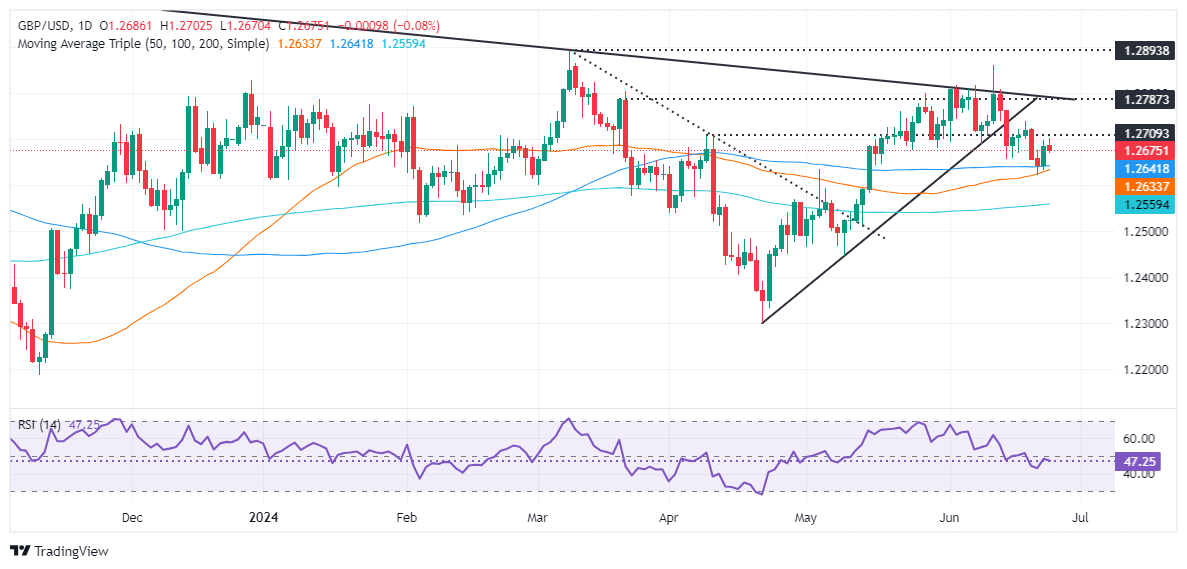
Source: Fx Street
I am Joshua Winder, a senior-level journalist and editor at World Stock Market. I specialize in covering news related to the stock market and economic trends. With more than 8 years of experience in this field, I have become an expert in financial reporting.


