
- GBP/USD could test the upper boundary at the level of 1.2850, followed by the nine-day EMA at the level of 1.2869.
- Technical analysis suggests a consolidation phase or a possible reversal for the pair.
- A break below the descending channel could lead the pair to navigate the region to the retracement support level of 1.2615.
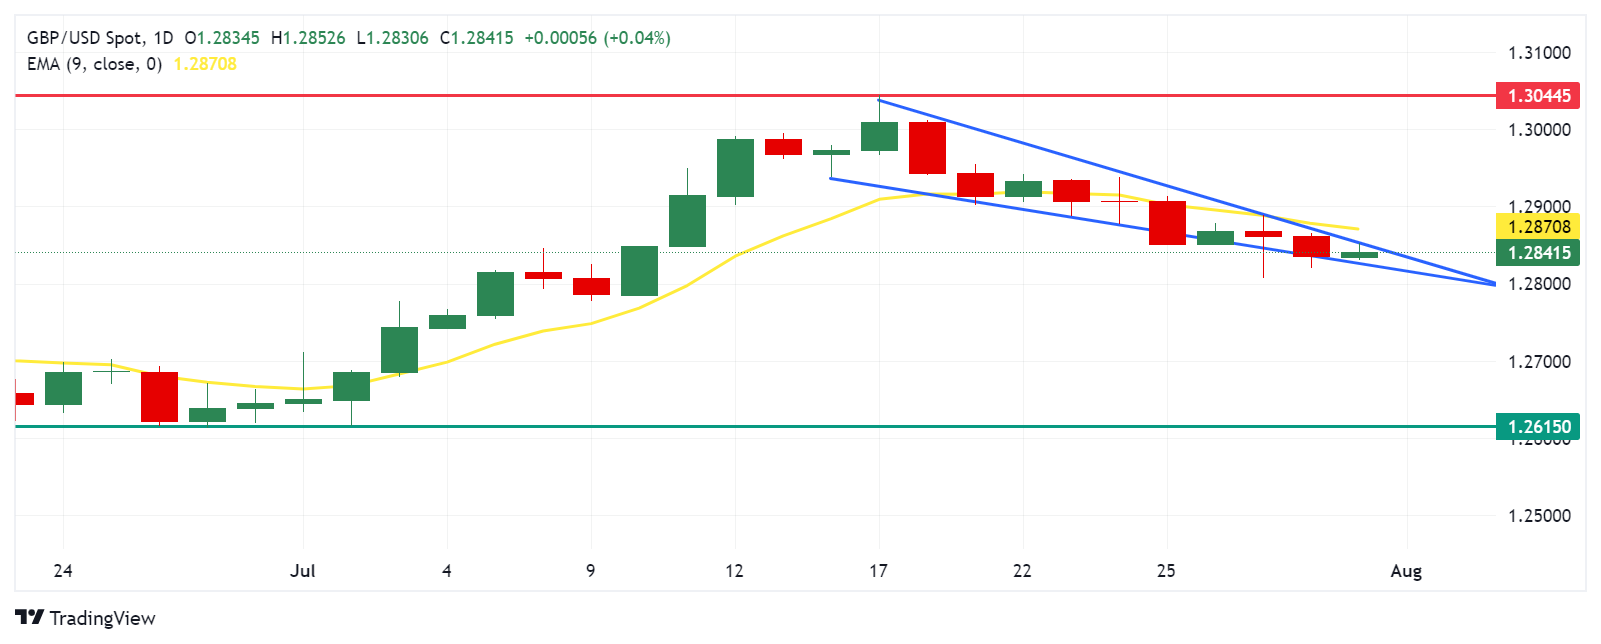
GBP/USD is recovering its recent losses, trading around 1.2840 during the Asian hours on Wednesday. The daily chart analysis indicates that the pair is positioned in the narrow section of a descending channel, suggesting a consolidation phase or a possible reversal.
The Moving Average Convergence Divergence (MACD) momentum indicator shows weakening bullish momentum as the MACD line is below the signal line but above the center line. Additionally, the 14-day Relative Strength Index (RSI) is hovering slightly below the 50 level, suggesting a bearish bias.
As for resistance, the immediate barrier appears around the upper boundary at the level of 1.2850, followed by the nine-day exponential moving average (EMA) at the level of 1.2869. A break above this level could lead the GBP/USD pair to explore the area around the yearly peak of 1.3044 reached on July 17.
On the downside, immediate support seems to be around the lower border of the descending channel at the 1.2525 level. A break below this level could put downward pressure on the GBP/USD pair to navigate the region around the 1.2615 retracement support level.
GBP/USD: Daily Chart
Pound Sterling PRICE Today
The table below shows the exchange rate of the British Pound (GBP) against major currencies today. The British Pound was the strongest currency against the Australian Dollar.
| USD | EUR | GBP | JPY | CAD | AUD | NZD | CHF | |
|---|---|---|---|---|---|---|---|---|
| USD | -0.09% | -0.07% | 0.12% | -0.05% | 0.72% | 0.00% | -0.04% | |
| EUR | 0.09% | 0.04% | 0.23% | 0.03% | 0.80% | 0.11% | 0.07% | |
| GBP | 0.07% | -0.04% | 0.18% | -0.01% | 0.75% | 0.07% | 0.02% | |
| JPY | -0.12% | -0.23% | -0.18% | -0.12% | 0.59% | -0.13% | -0.13% | |
| CAD | 0.05% | -0.03% | 0.00% | 0.12% | 0.74% | 0.05% | 0.00% | |
| AUD | -0.72% | -0.80% | -0.75% | -0.59% | -0.74% | -0.70% | -0.75% | |
| NZD | 0.00% | -0.11% | -0.07% | 0.13% | -0.05% | 0.70% | -0.05% | |
| CHF | 0.04% | -0.07% | -0.02% | 0.13% | -0.00% | 0.75% | 0.05% |
The heatmap shows percentage changes of major currencies. The base currency is selected from the left column, while the quote currency is selected from the top row. For example, if you choose the British Pound from the left column and move along the horizontal line to the US Dollar, the percentage change shown in the chart will represent the GBP (base)/USD (quote).
Source: Fx Street
I am Joshua Winder, a senior-level journalist and editor at World Stock Market. I specialize in covering news related to the stock market and economic trends. With more than 8 years of experience in this field, I have become an expert in financial reporting.


