
- GBP/USD pulls back a bit from a multi-month high, but lacks follow through.
- The technical setup continues to favor the bulls and supports prospects for further gains.
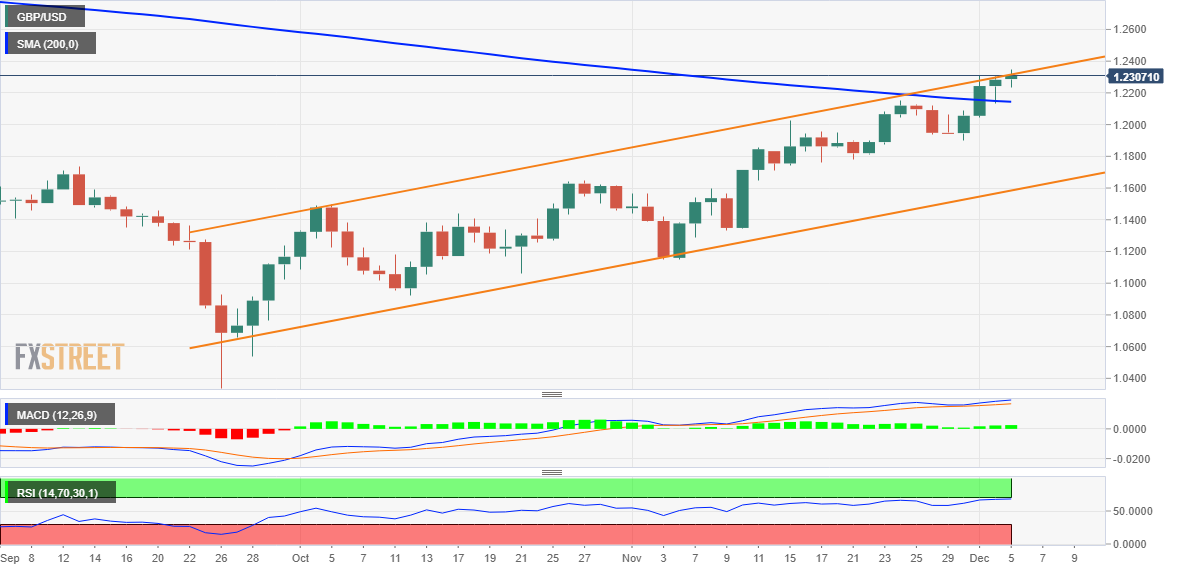
- A sustained break below the 200 DMA is needed to negate the positive outlook.
GBP/USD reverses a mid-European session slide towards the 1.2235-1.2230 zone and remains some distance from its highest level since June 17, hit earlier this Monday.
The dollar’s intraday rally attempt from five-month lows lacks bullish conviction amid bets that the Fed will slow the pace of its tightening as early as December. This, in turn, is seen as a key factor supporting the GBP/USD pair. However, the bleak outlook for the UK economy is acting as a headwind for sterling and keeping spot prices in check, at least for now.
From a technical point of view, the upper end of a rising channel of more than two months duration, currently around 1.2350, continues to limit the rise of the GBP/USD pair. That being said, last week’s sustained move and acceptance above a technically significant 200-day SMA for the first time in 2022 supports the prospects for an eventual breakout through the ascending channel.
That being said, oscillators on the daily chart have moved to the brink of breaking out of the overbought zone and warrant some caution. Therefore, it is prudent to wait for short-term consolidation or a modest pullback before positioning for the next leg up. However, the bias seems to remain firmly in favor of the bulls and supports the prospects of a further appreciation move in the near term.
Meanwhile, the daily low around the 1.2235-1.2230 zone seems to protect the immediate downside before 1.2200. Any further decline could continue to be viewed as a buying opportunity and be capped near the 1.2150 (200 DMA) region. The latter should act as a pivot point, which if broken decisively will nullify the positive outlook for the GBP/USD pair.
GBP/USD daily chart
Key levels to watch
Source: Fx Street
I am Joshua Winder, a senior-level journalist and editor at World Stock Market. I specialize in covering news related to the stock market and economic trends. With more than 8 years of experience in this field, I have become an expert in financial reporting.


, from photomontage to DNA analysis")
")

