
- GBP/USD hits a new weekly high on Thursday amid a sustained USD selling trend.
- Dovish comments from Fed Chairman Powell and weakness in US bond yields weigh on the dollar.
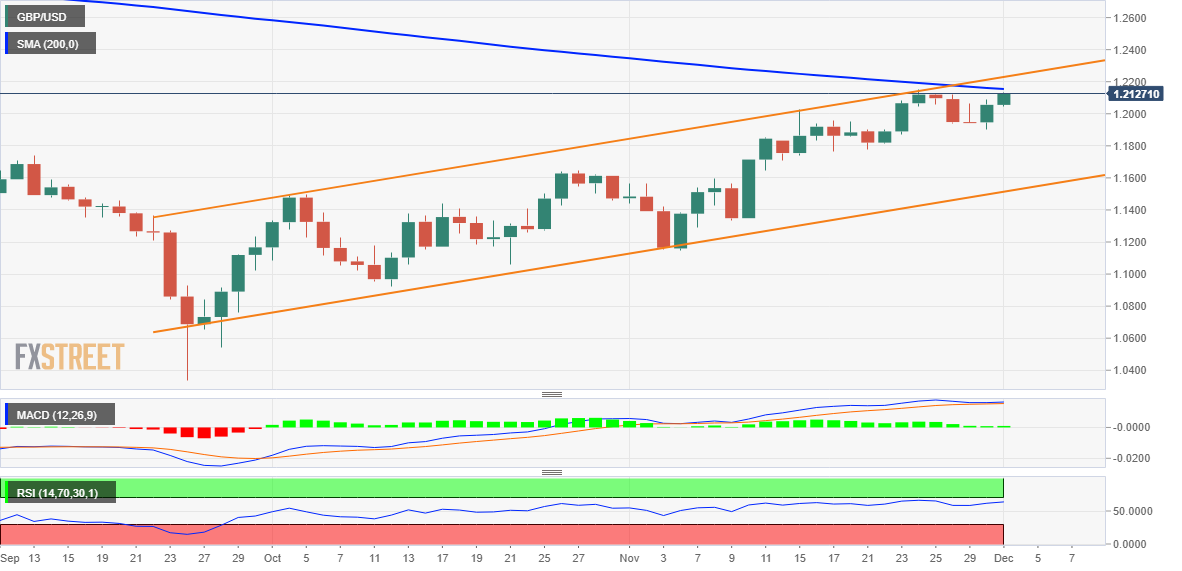
- The technical setup favors the bulls and supports prospects for further gains.
The pair GBP/USD extends Wednesday’s rebound from week-long lows and gains traction for the second day in a row on Thursday. The pair maintains its positive tone during the first half of the European session and reaches a new weekly high, around the 1.2135/40 zone in the last hour.
The moderate comments of the president of the Federal Reserve, Jerome Powell, along with a further decline in US Treasury yields, keep dollar bulls on the back foot near a multi-month low. Apart from this, a generally positive tone around equity markets is seen undermining the dollar.
From a technical point of view, the pair has approached the important 200-day SMA. Said barrier is currently set near the 1.2150 zone, which if breached will be seen as a new trigger for bullish traders and set the stage for an extension of the short-term appreciation move for GBP/USD.
As the oscillators on the daily chart remain in bullish territory and are still far from overbought, GBP/USD could try to recapture 1.2200. The momentum could extend further and take prices to the upper limit of a rising channel of more than two months, currently around 1.2300.
On the other hand, any significant pullback below 1.2100 seems to find good support near the daily low around the 1.2045 area. A convincing break below could trigger some technical selling and drag GBP/USD back towards the psychological 1.2000 level. Further lows will expose the horizontal support at 1.1945-1.1940.
The latter should act as a strong base for spot prices, which if broken decisively will nullify any near-term positive bias and pave the way for a deeper corrective decline. GBP/USD could then turn vulnerable to weaken further below 1.1900 and test the next relevant support near the 1.1860-1.1855 horizontal zone.
GBP/USD day chart
Key levels to watch
Source: Fx Street
I am Joshua Winder, a senior-level journalist and editor at World Stock Market. I specialize in covering news related to the stock market and economic trends. With more than 8 years of experience in this field, I have become an expert in financial reporting.


