
- GBP/USD moves higher on Wednesday amid a weaker dollar, though there is no follow up.
- The recent pullback forms a descending channel on the 1 hour chart.
- Traders appear reluctant to open aggressive positions ahead of the FOMC.
The GBP/USD pair attracts some buying on Wednesday and pulls away from a multi-day low hit the day before, though it lacks continuation. The pair maintains its buying tone at the start of the European session and is currently just above the psychological level of 1.1500.
Speculation that the Fed will soften its hawkish stance amid signs of a slowdown in the US economy keep dollar bulls on the defensive and offer some support to GBP/USD. However, traders appear reluctant to open aggressive positions preferring to stay on the sidelines ahead of the FOMC. The Fed is due to announce its monetary policy decision on Wednesday, which will be followed by the Bank of England meeting on Thursday. Investors will be looking for further clues as to the pace of the rate hike cycle, which in turn should help determine the next directional move for GBP/USD.
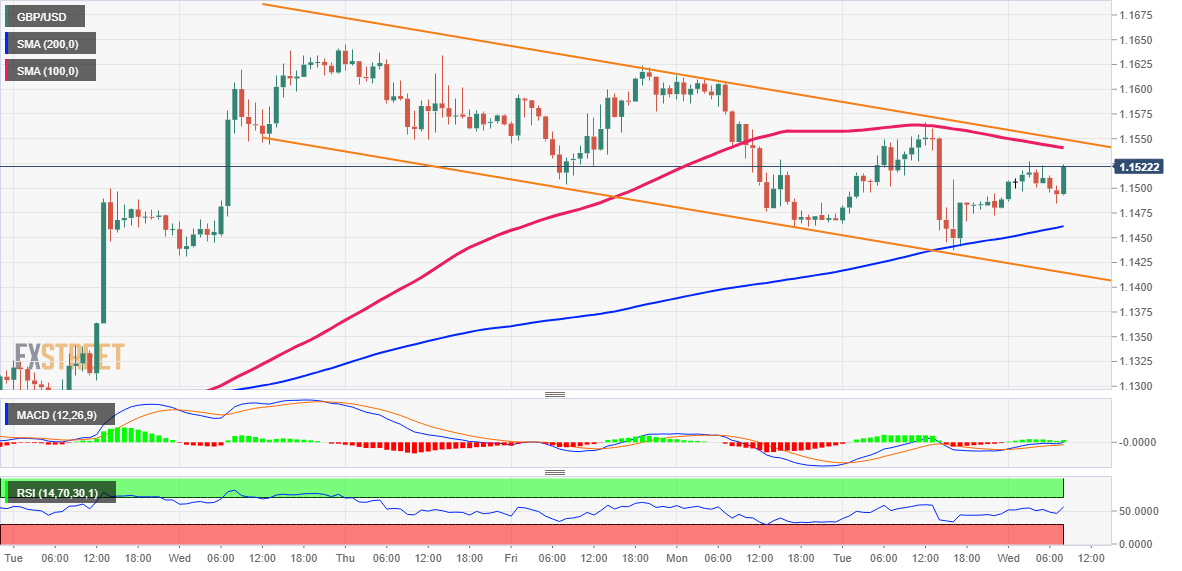
Generally speaking, the recent corrective pullback from around 1.1650, or a 6-week high, forms a descending channel on the 1 hour chart. The upper end of this channel, currently around the 1.1545-1.1550 area, coincides with the 100-hour SMA and should act as a key point. Sustained strength beyond this region will be seen as a new trigger for the bulls and will allow the GBP/USD pair to reclaim the 1.1600 level. The momentum could extend towards the 1.1645 area. Continuation buying would set the stage for an extension of the recent strong recovery from a record low.
On the other hand, the 200 hour SMA around the 1.1460 area could protect the immediate decline, ahead of the descending channel support near the 1.1410-1.1400 area. A convincing break below this zone will negate any short-term positive bias and make the GBP/USD pair vulnerable to accelerate the decline towards the 1.1355-1.1350 region. The next relevant support is near the 1.1300 round level before the pair finally drops to the 1.1225-1.1220 region en route to the 1.1200 level.
GBP/USD 1 hour chart
GBP/USD key levels
Source: Fx Street
With 6 years of experience, I bring to the table captivating and informative writing in the world news category. My expertise covers a range of industries, including tourism, technology, forex and stocks. From brief social media posts to in-depth articles, I am dedicated to creating compelling content for various platforms.


