
- GBP/USD trims some of last Friday’s losses but remains stuck between the 20-50 DMA.
- The daily chart shows the pair in a descending channel as sellers watch the 20-day EMA.
- The GBP/USD 4-hour chart shows the pair with a neutral bias to the downside and could test the 1.2000 figure in the near term.
The GBP/USD It posts minimal gains after hitting a daily high at 1.2137, far from the 50-day EMA at 1.2166, which has proven to be solid resistance over the last four days. However, the British Pound slipped back below 1.2100 but remained above the opening price, recording gains of 0.12%. At the time of writing, the GBP/USD pair is trading at 1.2081.
GBP/USD Price Analysis: Technical Outlook
The GBP/USD daily chart is showing a neutral downward trend. One more confirmation of the above is that the sellers are gaining momentum, as evidenced by the Relative Strength Index (RSI), pointing lower, residing below the mid-50 line. Also, the major trades within a descending channel and spot price is 50 pips from the 20-day EMA at 1.2039. Once breached, a drop to the bottom of the channel near the year’s low at 1.1759 would be exacerbated.
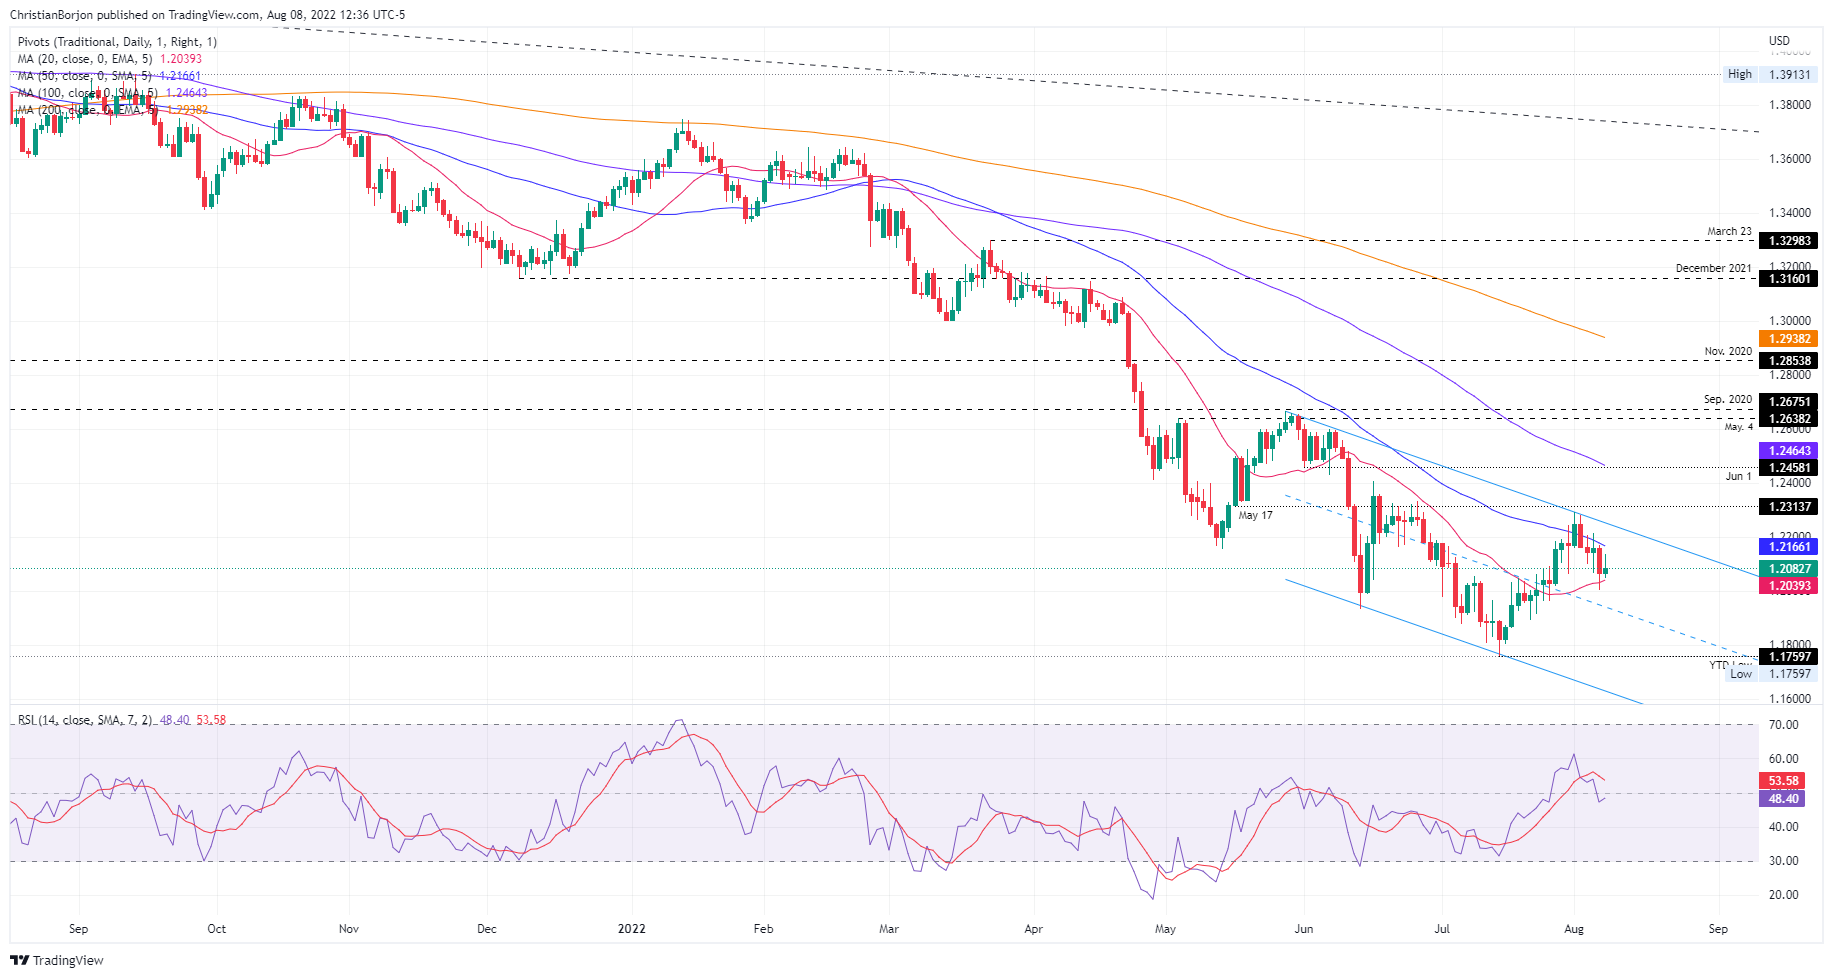
GBP/USD daily chart
Meanwhile, the GBP/USD 4-hour chart shows that an ascending channel broke down last Friday, adding more selling pressure to the pair. Notably, GBP/USD buyers lifted the pair from the confluence of the 100 and 200 EMAs, near the 1.2040 lows for the day. However, sellers huddled around the 20 EMA at 1.2113 weighed on the pair, which slipped below 1.2100.
Therefore, the GBP/USD 4-hour chart continues to have a neutral bias to the downside. Therefore, the first support for the GBP/USD would be the confluence of the 100 and 200 EMAs around 1.2065-68. If it breaks below, the pair will drop towards pivot S1 at 1.1990, followed by S2 at 1.1910.
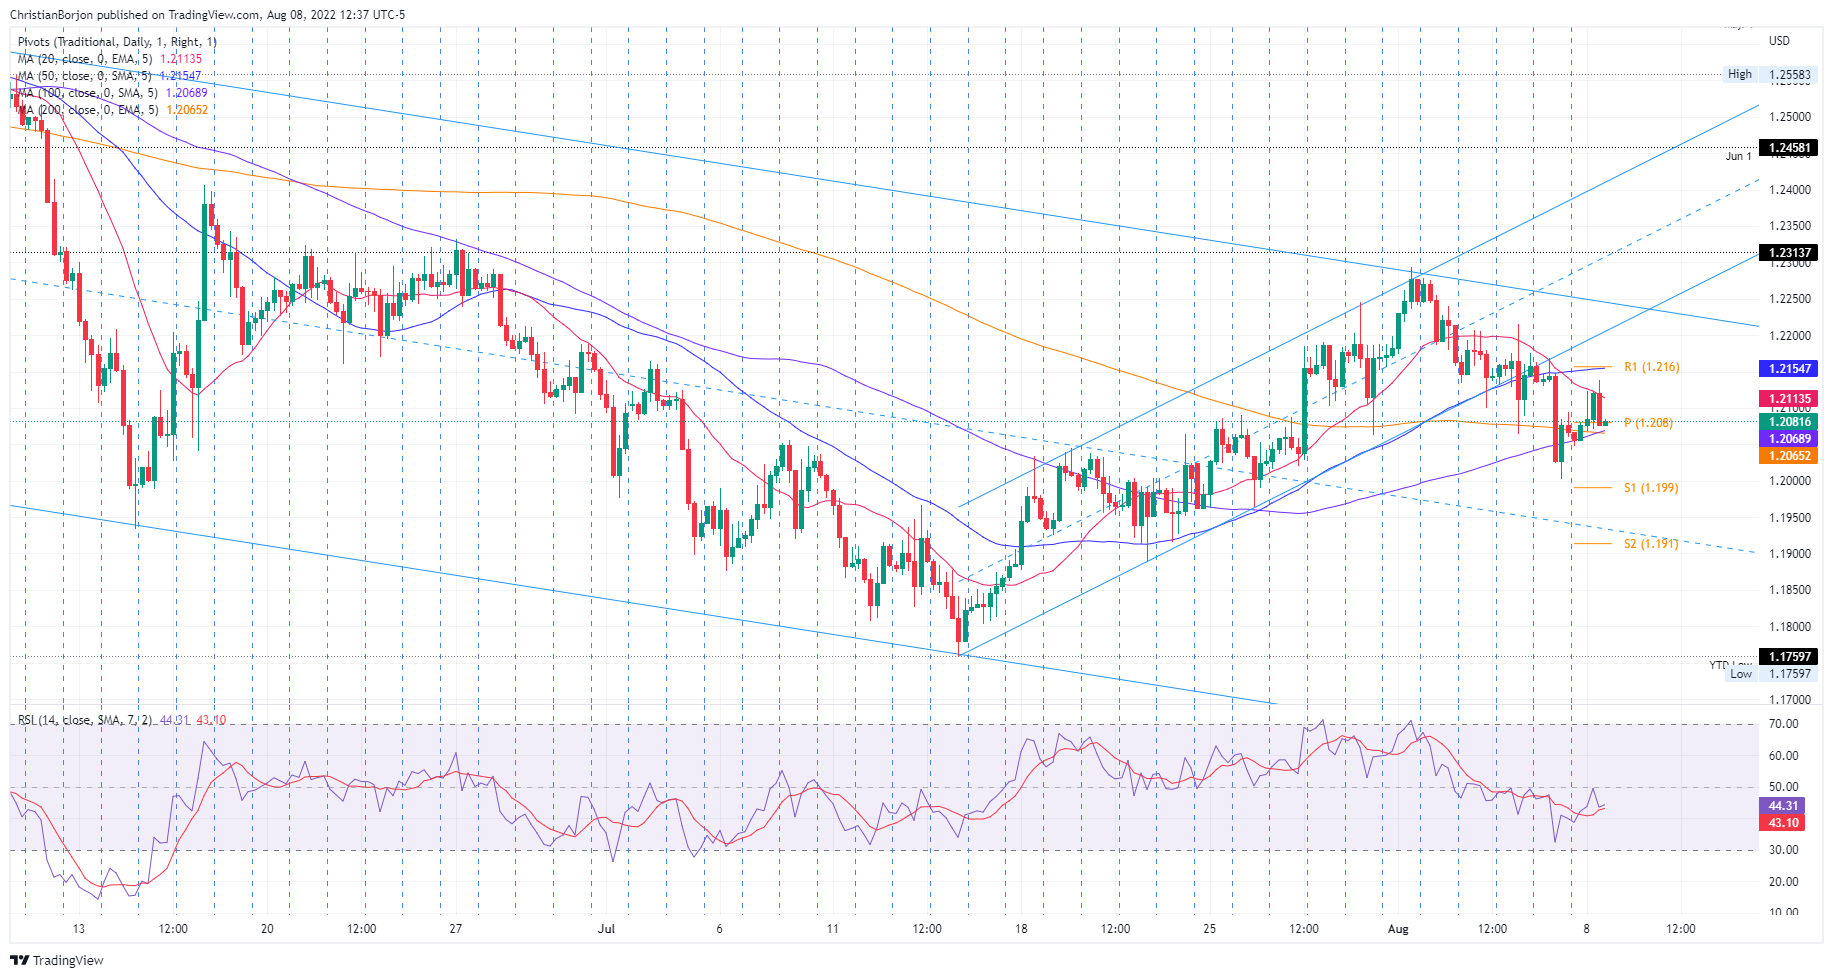
GBP/USD 4-hour chart
Technical levels
Source: Fx Street
With 6 years of experience, I bring to the table captivating and informative writing in the world news category. My expertise covers a range of industries, including tourism, technology, forex and stocks. From brief social media posts to in-depth articles, I am dedicated to creating compelling content for various platforms.

; see video")


