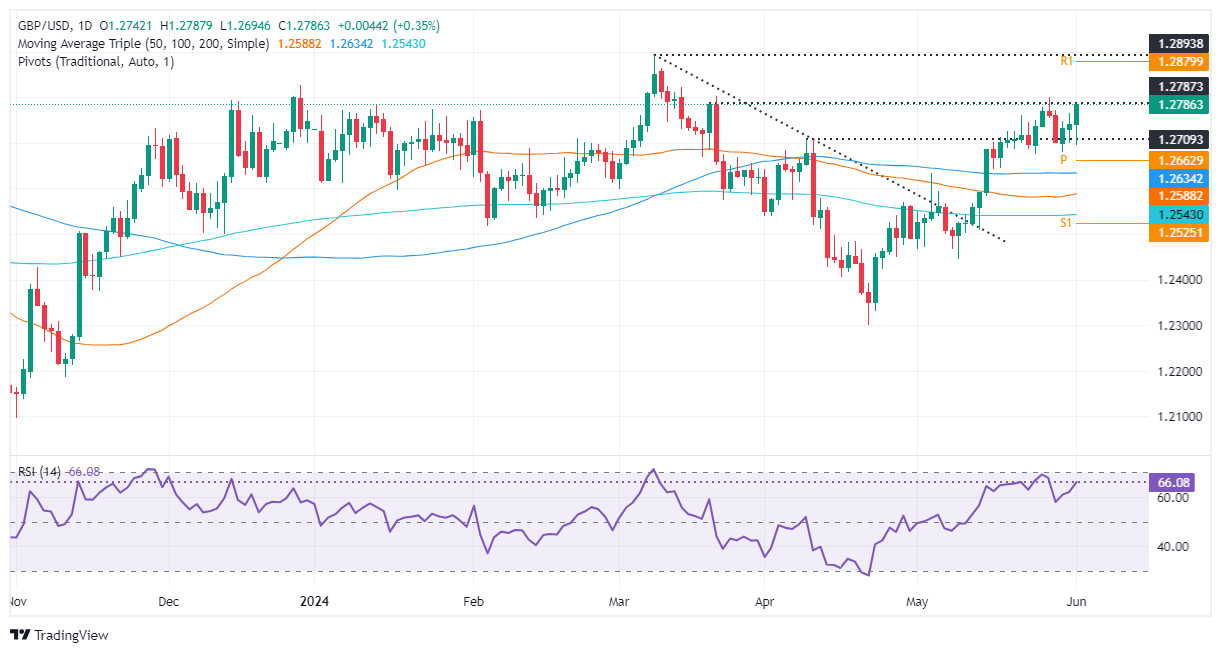
- GBP/USD rises to 1.2772, near a four-day high of 1.2784.
- The technical picture shows a bullish bias with the RSI pointing higher but not yet overbought.
- Key resistance at 1.2800; Breaking above it could lead to the year's high of 1.2893, while support lies at 1.2643 and 1.2600.
The British Pound rose for the third consecutive day against the US Dollar, gaining around 0.37% in early trading during the North American session. GBP/USD traded at 1.2785, close to a four-day high of 1.2787 reached during the European session.
GBP/USD Price Analysis: Technical Overview
From a daily chart perspective, GBP/USD has a bullish bias as buyers gain momentum, reflected in the RSI. The RSI is pointing up but with margin before becoming overbought.
That said, buyers need to break through the cluster of technical levels, with the 1.2800 figure and a descending resistance trend line running through that area. Once broken, the next stop would be the year's high of 1.2893, which is close to 1.2900.
On the other hand, if GBP/USD falls below 1.2700, that could support a decline towards the confluence of the May 3 high-turned-support and the 10-day moving average (DMA) around 1.2643. Additional losses are found at 1.2600.
GBP/USD Price Action – Daily Chart
GBP/USD
| Summary | |
|---|---|
| Latest price today | 1.2788 |
| Today's daily change | 0.0046 |
| Daily change % today | 0.36 |
| Today's daily opening | 1.2742 |
| Trends | |
|---|---|
| SMA20 Journal | 1.2655 |
| SMA50 Daily | 1.2585 |
| SMA100 Journal | 1.2634 |
| SMA200 Journal | 1.2542 |
| Levels | |
|---|---|
| Previous Daily High | 1.2766 |
| Previous Daily Low | 1.27 |
| Previous Weekly High | 1.2801 |
| Previous Weekly Low | 1.2681 |
| Previous Monthly High | 1.2801 |
| Previous Monthly Low | 1.2446 |
| Daily Fibonacci 38.2% | 1.2741 |
| Daily Fibonacci 61.8% | 1.2726 |
| Daily Pivot Point S1 | 1.2706 |
| Daily Pivot Point S2 | 1.2671 |
| Daily Pivot Point S3 | 1.2641 |
| Daily Pivot Point R1 | 1.2772 |
| Daily Pivot Point R2 | 1.2802 |
| Daily Pivot Point R3 | 1.2838 |
Source: Fx Street
I am Joshua Winder, a senior-level journalist and editor at World Stock Market. I specialize in covering news related to the stock market and economic trends. With more than 8 years of experience in this field, I have become an expert in financial reporting.


