
- GBP/USD tests the key support-turned-resistance trend line around 1.2730.
- The technical outlook shows favorable momentum for buyers, but unable to sustain gains above 1.2800.
- Key resistance at 1.2739 and 1.2800, with support levels at 1.2700, 1.2643 and 1.2617.
The British Pound gains modestly against the Dollar on Wednesday amid low liquidity conditions as US traders observe Juneteenth. Therefore, with US markets closed, GBP/USD could remain contained and trade at 1.2729 at the time of writing.
GBP/USD Price Analysis: Technical Perspective
After hitting a three-month high at 1.2860, GBP/USD fell more than 100 pips and broke a support trend line drawn from the May 17 lows passing around 1.2730.
Although momentum favors buyers with the Relative Strength Index (RSI) above the neutral line of 50, the pair has failed to sustain the uptrend above 1.2800.
Risk events, such as the latest inflation report, failed to bring GBP/USD close to 1.2800. That, along with the Bank of England’s decision on Thursday, will keep the pair trading volatile in the coming days.
Key resistance levels lie at 1.2739, the current week’s high, followed by 1.2800. Once surpassed, the next stop would be the monthly high of 1.2860.
Conversely, if GBP/USD falls below 1.2700, that will expose the confluence of technical indicators, such as the May 3 high turned support and the 50-day moving average (DMA) at 1.2643/39, before 50-day DMA at 1.2617. More losses are found once breached, such as the 1.2600 figure and the 200-day DMA at 1.2550.
GBP/USD Price Action – Daily Chart
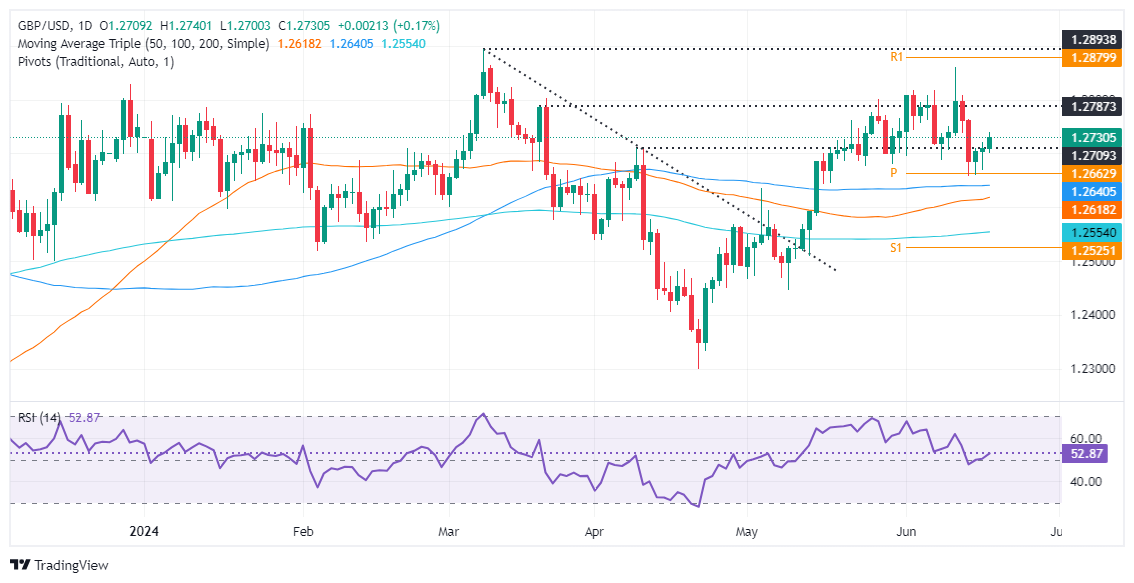
Source: Fx Street
I am Joshua Winder, a senior-level journalist and editor at World Stock Market. I specialize in covering news related to the stock market and economic trends. With more than 8 years of experience in this field, I have become an expert in financial reporting.


