
- GBP/USD rallied almost 1% or 114 points on Friday, after US NFP.
- Bulls struggle at the 200 day EMA, exacerbating a 60-pip drop in GBP/USD to current levels.
- GBP/USD Price Analysis: Bias is to the downside, but upside risks remain.
He GBP/USD It picks up some ground and is set to end the week with minimal gains after rebounding from year-end lows at 1.1802, with buyers retrieving 1.2000 after a mixed US jobs report. As of this writing, the GBP/USD is trading at 1.2040, up 1.01% from its opening price.
GBP/USD: Price Action
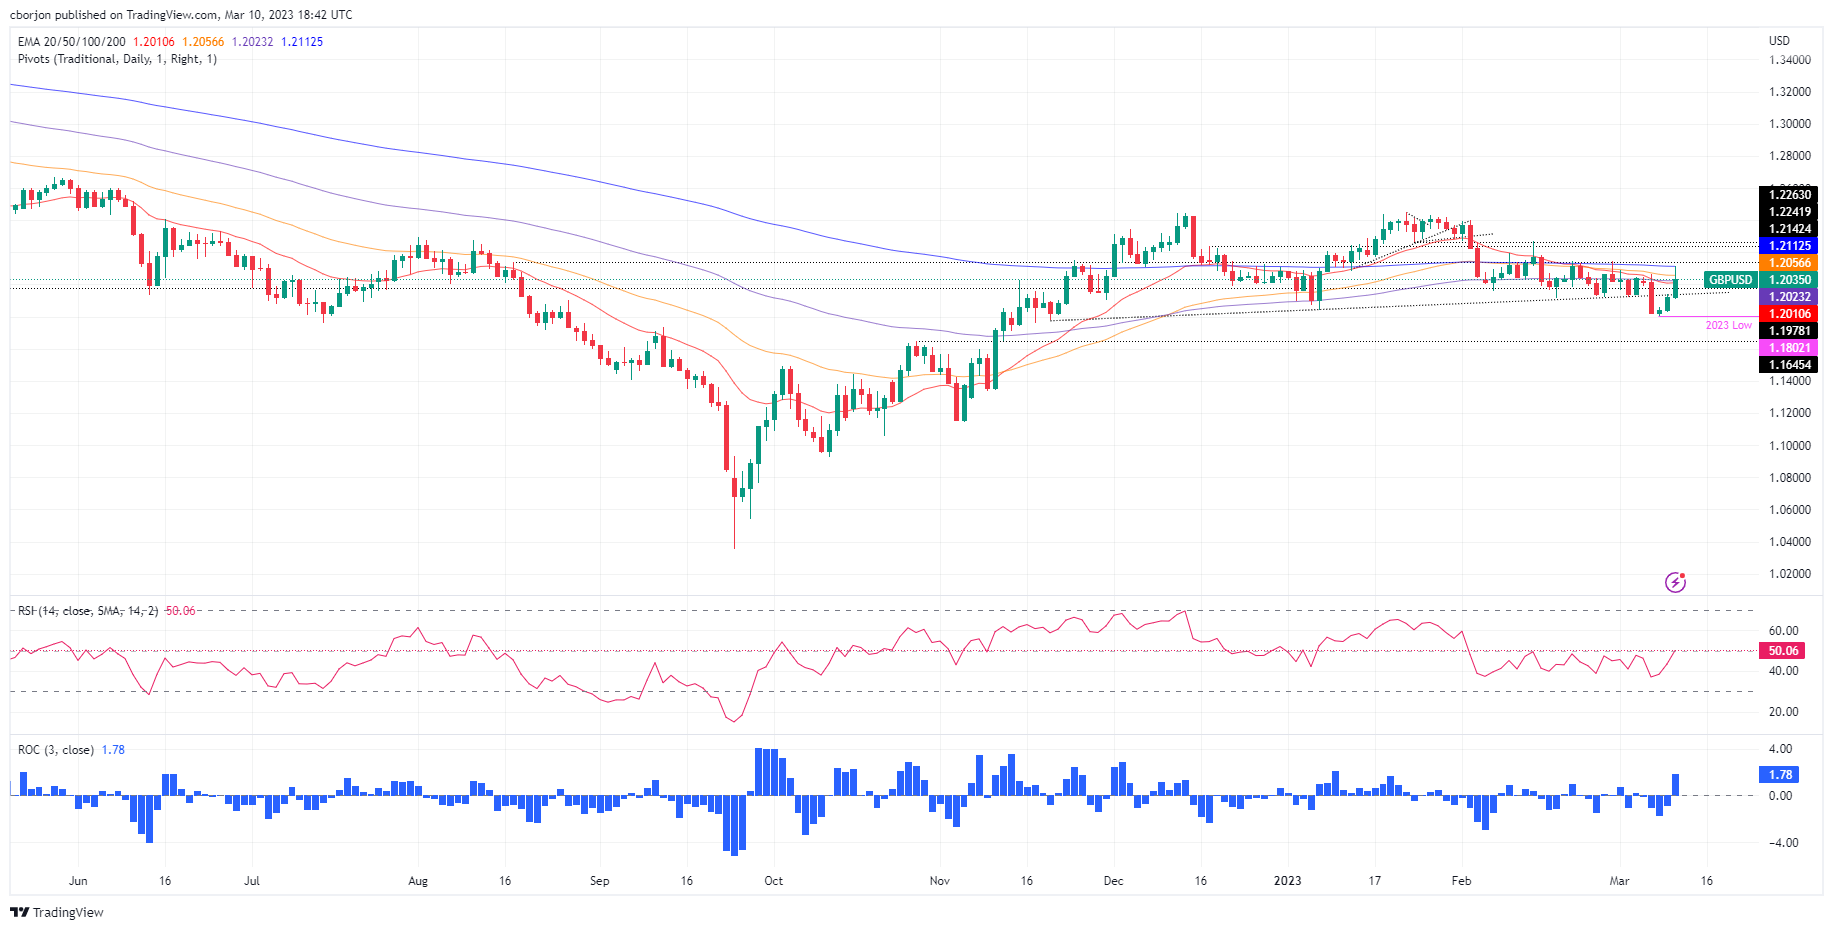
GBP/USD has recaptured the 1.2000 level, but its bias has not changed. Following the release of the US Non-Farm Payrolls report, the British pound (GBP) reached the 200-day EMA at 1.2112. However, sellers intervened and dragged the pair below 1.2100.
On its way south, the GBP/USD pair traded below the 50 day EMA, hovering around known levels. However, the 100 and 20 day EMAs are below current prices, warranting further consolidation going forward.
For a bearish resumption, GBP/USD needs to break out of the 100 and 20 day EMAs, each at 1.2023 and 1.2010, respectively. After that, the 1.2000 figure could be reached, paving the way for further decline. The next support would be the figure of 1.1900, before the low of the year at 1.1802.
Conversely, GBP/USD must retrace the 50-day EMA at 1.2056 if buyers are to remain hopeful of a reversal of the trend. The next resistance would be 1.2100, followed by the 200 day EMA at 1.2112.
GBP/USD Daily Chart
GBP/USD Technical Levels
Source: Fx Street
I am Joshua Winder, a senior-level journalist and editor at World Stock Market. I specialize in covering news related to the stock market and economic trends. With more than 8 years of experience in this field, I have become an expert in financial reporting.


