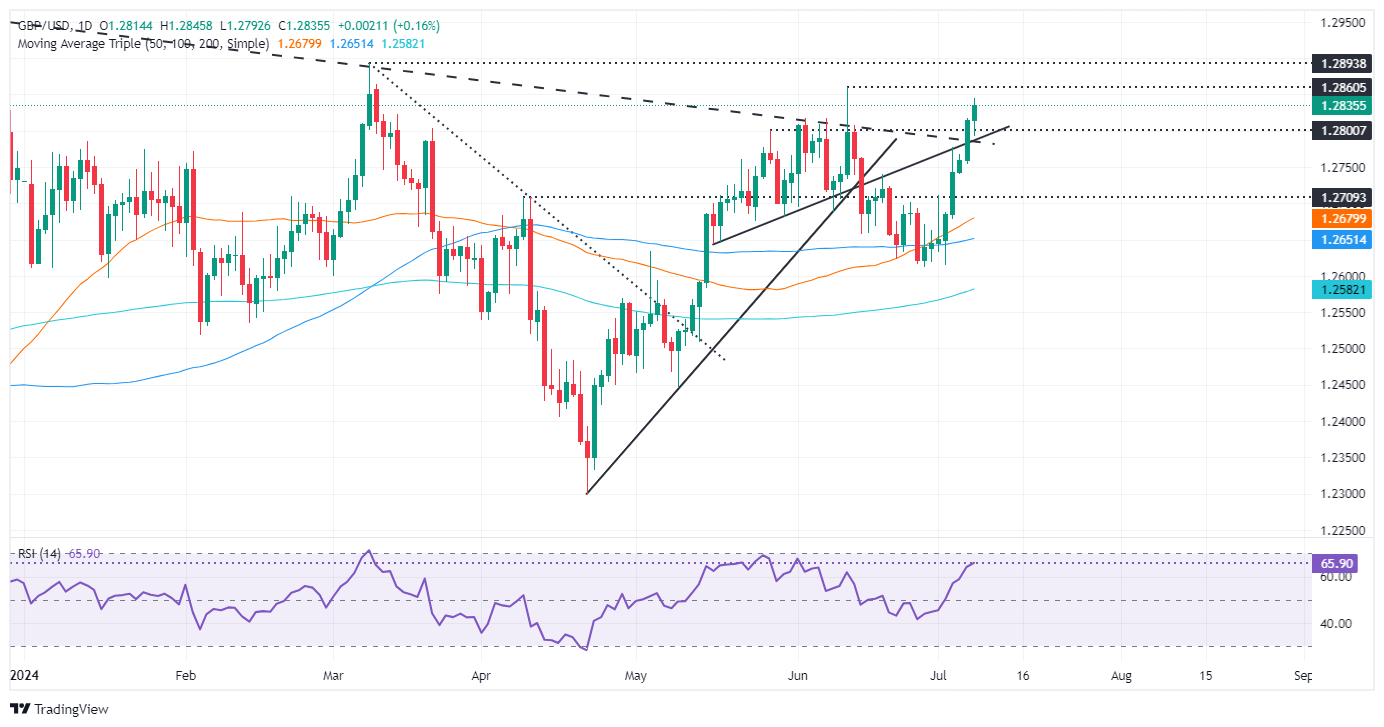
- GBP/USD continued to rise for eight consecutive days,
- The US economic agenda led by Fed Chairman Jerome Powell and inflation data will set the course for GBP/USD.
- The pair has a bullish bias, with buyers ready to test 1.2900.
The British Pound started the week on a positive note and recorded gains of over 0.20%, while the Dollar continued to decline, amid growing expectations that the Federal Reserve could cut borrowing costs in September. A busy week on the US agenda will include speeches by Fed Chair Jerome Powell at the US Congress, while Wednesday’s inflation data will set the stage for the next Fed decision. GBP/USD is trading at 1.2844, around four-week highs.
GBP/USD Price Analysis: Technical Outlook
From a technical perspective, the GBP/USD pair has made a significant move. It has broken a descending resistance trend line dating back to the August 2023 highs. This trend line has now turned into a support level, following the pair’s breach of the psychological level of 1.2750.
The momentum suggests that buyers could push the exchange rate higher, as shown by the RSI in bullish territory.
This would put the year-to-date high of 1.2893 into play, and further Pound strength could push the pair above 1.2900, with buyers targeting the July 27, 2023 high of 1.2995.
For a bearish continuation, the first support to take would be the 50-day moving average (DMA) at 1.2678, followed by the 100-day moving average (DMA) at 1.2650, and the last cycle low being the June 27 low of 1.2612.
GBP/USD Price Action – Daily Chart
Pound Sterling PRICE Today
The table below shows the exchange rate of the British Pound (GBP) against major currencies today. The British Pound was the strongest currency against the Swiss Franc.
| USD | EUR | GBP | JPY | CAD | AUD | NZD | CHF | |
|---|---|---|---|---|---|---|---|---|
| USD | 0.05% | -0.16% | -0.11% | -0.09% | 0.03% | -0.04% | 0.13% | |
| EUR | -0.05% | -0.01% | 0.16% | 0.17% | 0.14% | 0.25% | 0.41% | |
| GBP | 0.16% | 0.01% | 0.14% | 0.20% | 0.15% | 0.26% | 0.42% | |
| JPY | 0.11% | -0.16% | -0.14% | 0.02% | 0.16% | 0.23% | 0.29% | |
| CAD | 0.09% | -0.17% | -0.20% | -0.02% | 0.08% | 0.06% | 0.24% | |
| AUD | -0.03% | -0.14% | -0.15% | -0.16% | -0.08% | 0.11% | 0.27% | |
| NZD | 0.04% | -0.25% | -0.26% | -0.23% | -0.06% | -0.11% | 0.16% | |
| CHF | -0.13% | -0.41% | -0.42% | -0.29% | -0.24% | -0.27% | -0.16% |
The heatmap shows percentage changes of major currencies. The base currency is selected from the left column, while the quote currency is selected from the top row. For example, if you choose the British Pound from the left column and move along the horizontal line to the US Dollar, the percentage change shown in the chart will represent the GBP (base)/USD (quote).
Source: Fx Street
I am Joshua Winder, a senior-level journalist and editor at World Stock Market. I specialize in covering news related to the stock market and economic trends. With more than 8 years of experience in this field, I have become an expert in financial reporting.


