
- GBP/USD posts solid gains on Monday on low volume.
- From a daily chart perspective, the pair could challenge the yearly high and 1.2900.
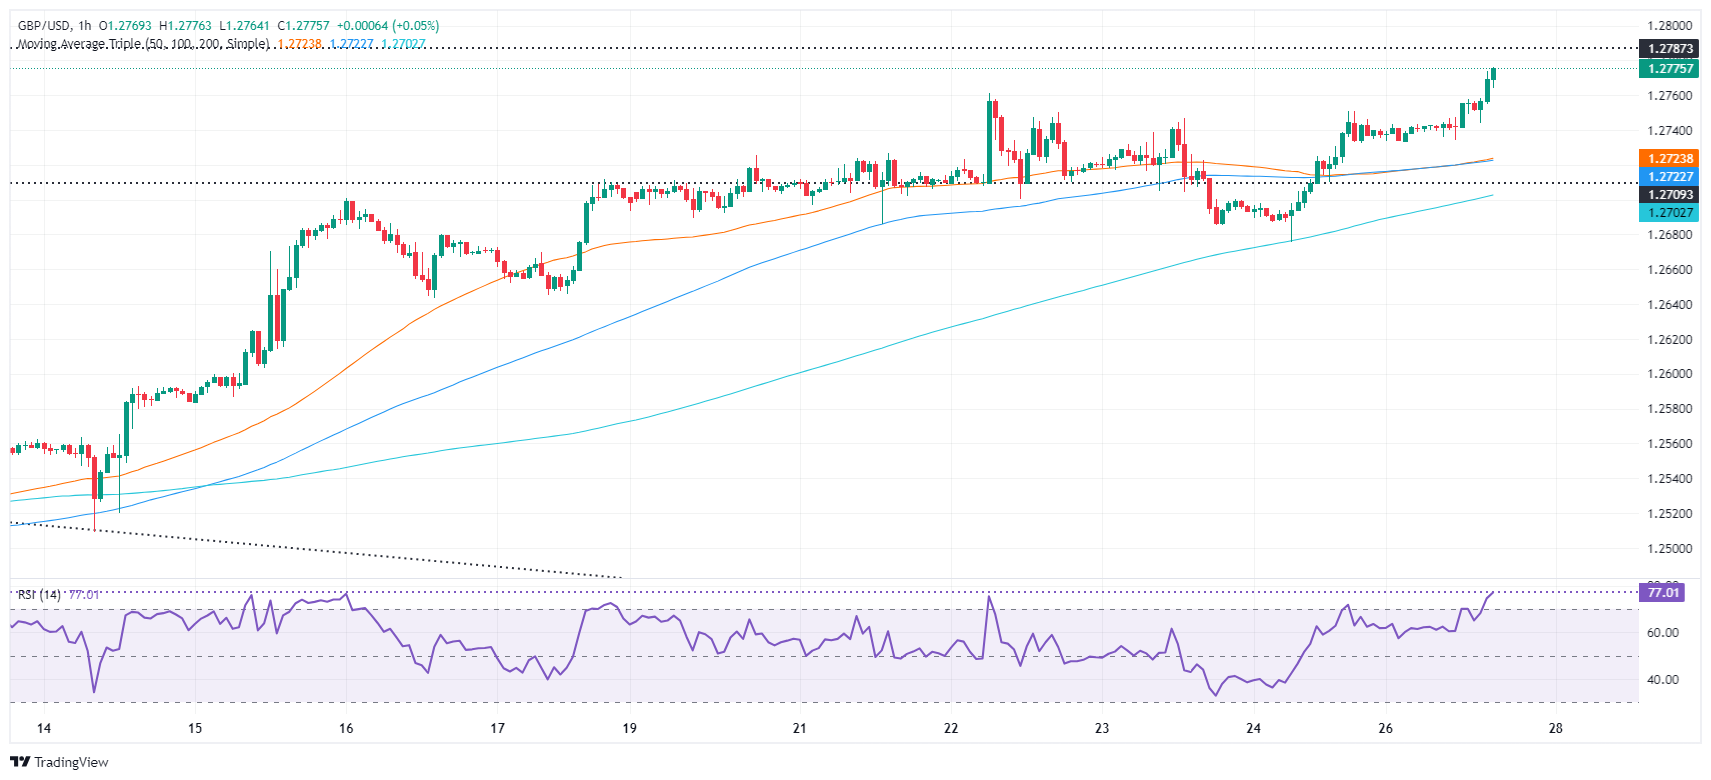
- In the short term, as the RSI is overbought, look for a pullback to 1.2750 and 1.2700.
The British Pound rose 0.30% against the Dollar on Monday amid low liquidity conditions due to holidays in the UK and US. At the time of writing, GBP/USD is trading at 1.2772 after hitting a low daily 1.2728.
GBP/USD Price Analysis: Technical Outlook
The GBP/USD daily chart shows the pair with a bullish bias, aiming to challenge the March 21 cycle high at 1.2803. If broken stronger, the next target is the year's high at 1.2894. If it fails, sellers could keep the pair within the range of 1.2700 – 1.2800 ahead of the release of the core US Personal Consumption Expenditures (PCE) Price Index on Friday.
In the short term, GBP/USD has broken the last cycle peak at 1.2761, exposing resistance levels. Despite that, caution is advised as the momentum suggests that buying pressure could be easing as the Relative Strength Index (RSI) has become overbought. In that case, sellers could intervene once the RSI falls below 70.
If GBP/USD pulls back below 1.2750, the next stop would be the day's current low of 1.2728. Once surpassed, the next stop would be the 1.2700 mark.
GBP/USD Price Action – Hourly Chart
Price of the Pound Sterling Today
The table below shows the percentage change of the British Pound Sterling (GBP) against the major currencies listed today. The British Pound was the strongest against the US Dollar.
| USD | EUR | GBP | JPY | CAD | AUD | NZD | CHF | |
|---|---|---|---|---|---|---|---|---|
| USD | -0.09% | -0.30% | -0.13% | -0.24% | -0.44% | -0.56% | -0.07% | |
| EUR | 0.09% | -0.23% | -0.02% | -0.15% | -0.41% | -0.56% | 0.05% | |
| GBP | 0.30% | 0.23% | 0.16% | 0.05% | -0.17% | -0.27% | 0.25% | |
| JPY | 0.13% | 0.02% | -0.16% | -0.16% | -0.34% | -0.37% | 0.02% | |
| CAD | 0.24% | 0.15% | -0.05% | 0.16% | -0.22% | -0.32% | 0.11% | |
| AUD | 0.44% | 0.41% | 0.17% | 0.34% | 0.22% | -0.07% | 0.42% | |
| NZD | 0.56% | 0.56% | 0.27% | 0.37% | 0.32% | 0.07% | 0.48% | |
| CHF | 0.07% | -0.05% | -0.25% | -0.02% | -0.11% | -0.42% | -0.48% |
The heat map shows the percentage changes of the major currencies against each other. The base currency is chosen from the left column, while the quote currency is chosen from the top row. For example, if you choose the British Pound from the left column and move along the horizontal line to the US Dollar, the percentage change shown in the box will represent GBP (base)/USD (quote).
Source: Fx Street
I am Joshua Winder, a senior-level journalist and editor at World Stock Market. I specialize in covering news related to the stock market and economic trends. With more than 8 years of experience in this field, I have become an expert in financial reporting.


