
- GBPUSD extends the downtrend for the second day in a row and plunges to a two-week low.
- The sharp intraday drop confirms a bearish break through the confluence support at 1.1370.
- The oversold of the RSI (14) on the hourly chart advises some caution before making further bearish bets.
The pair GBP/USD extends the previous day’s sharp drop after the FOMC from the 1.1565 area and remains under strong selling pressure for the second day in a row on Thursday. The bearish trajectory picks up after the announcement of the Bank of England’s policy decision and drags spot prices to a new two-week low, approaching 1.1150 during the early American session.
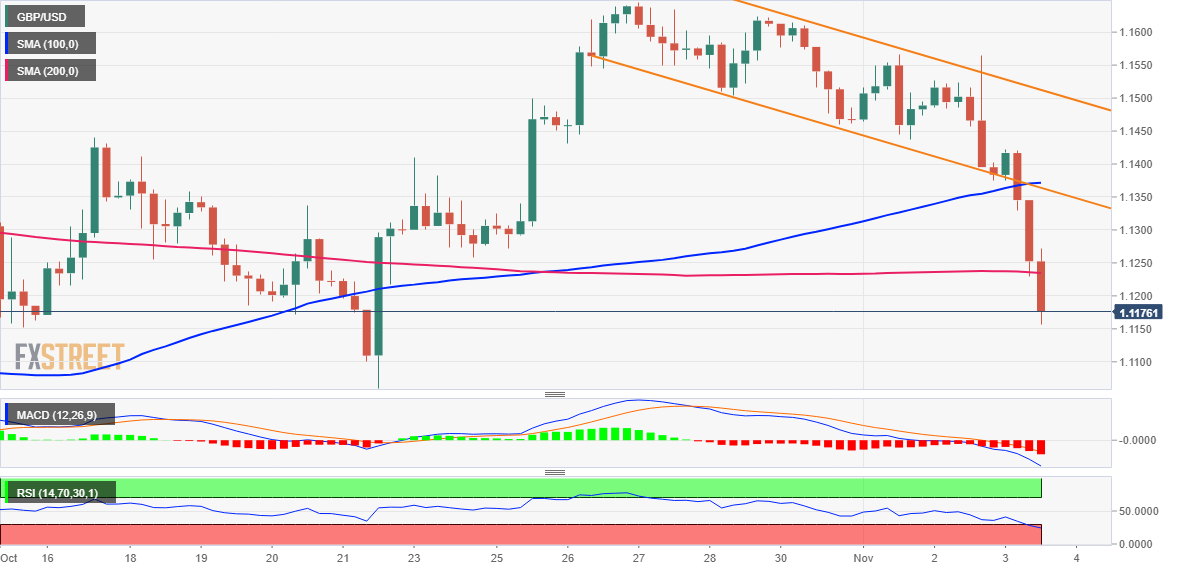
A convincing break of confluence support at 1.1370, comprising the lower end of a week-long descending channel and the 100-period SMA on the 4hr chart, was seen as a key trigger for bearish traders. Some follow-through selling below the 200-period SMA and the 1.1200 round figure is compounding the downside pressure and could have set the stage for a further downside move.
The negative outlook is reinforced by the fact that the oscillators on the daily chart have just started drifting into bearish territory. That said, the RSI (14) on the hourly chart is already showing oversold conditions, so it is prudent to wait for a consolidation or a modest bounce before the next leg lower. However, the GBPUSD looks poised to extend its recent decline from a multi-week high.
The next relevant target on the downside is set near the 1.1100 round level before the price finally drops to the 1.1060 area. The bearish trajectory could extend to the psychological level of 1.1000 on the way to the monthly low of September, around the 1.0925 area.
On the other hand, any significant recovery attempts could attract new sellers near 1.1200. This, in turn, should cap the GBPUSD close to the 200-period SMA on the 4hrs chart, currently around the 1.1235-1.1240 region. Sustained strength beyond that, while looking unlikely, could trigger a recovery of short positions and allow the bulls to reclaim the round 1.1300 level.
GBP/USD 4-hour chart
Key levels to watch
Source: Fx Street
With 6 years of experience, I bring to the table captivating and informative writing in the world news category. My expertise covers a range of industries, including tourism, technology, forex and stocks. From brief social media posts to in-depth articles, I am dedicated to creating compelling content for various platforms.


