
- GBP/USD rises to 1.2842, boosted by comments from BoE Chairman Huw Pill.
- Bullish momentum intact, targeting June 12 high of 1.2861 and yearly high of 1.2894.
- Key Support Levels: 1.2800, 1.2755/70, and 1.2690 (50-day Moving Average) for possible reversals.
The British pound resumed its upward trend on Wednesday and rose sharply following comments from Bank of England Chief Economist Huw Pill that the Monetary Policy Committee (MPC) should be cautious in viewing a single data point as a trigger for policy reassessment. Therefore, GBP/USD is trading at 1.2842, posting gains of 0.44%.
GBP/USD Price Analysis: Technical Outlook
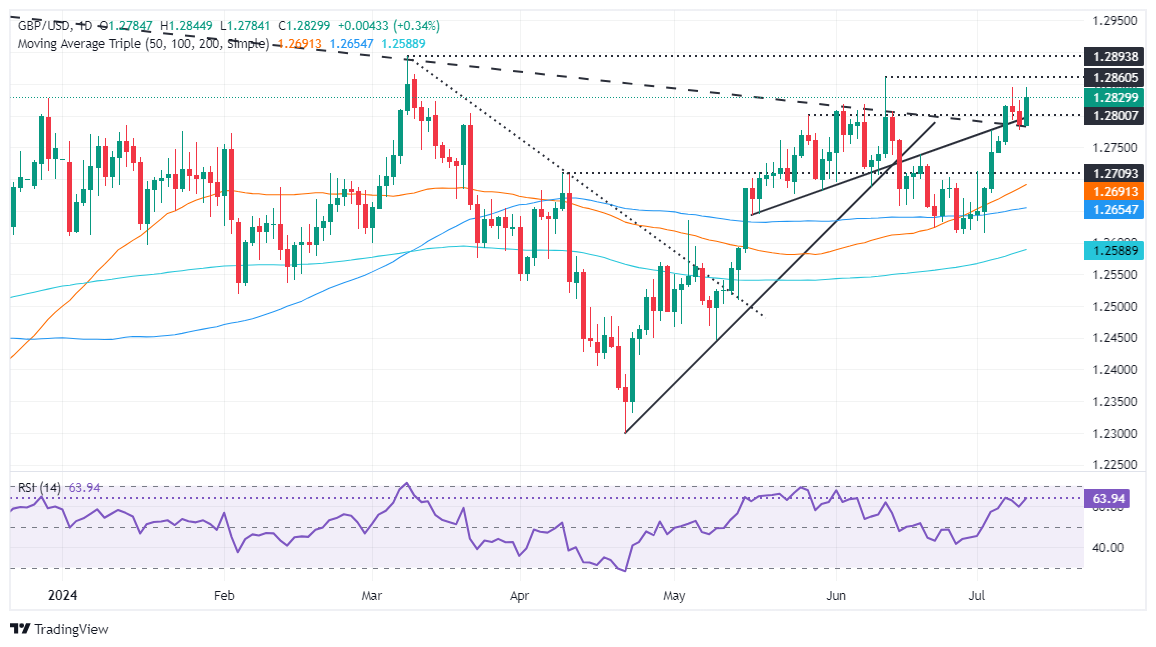
From a technical perspective, GBP/USD resumed its uptrend after bouncing off weekly lows set on Tuesday around 1.2779, with buyers stepping in and pushing the exchange rate higher. Momentum favors buyers, as shown by RSI, and the pair could test the yearly high in the near term.
The first resistance for GBP/USD would be the June 12 high at 1.2861. Once overcome, the next target would be the yearly high at 1.2894, followed by 1.2900 and the 1.3000 level.
Conversely, if GBP/USD turns negative and falls below 1.2800, the first support would be the confluence of two supporting trendlines around 1.2755/70, followed by the 50-day moving average (DMA) at 1.2690. A trend change is seen once the pair falls below the June 27 cycle low of 1.2612.
GBP/USD Price Action – Daily Chart
The Pound Sterling
The Pound Sterling (GBP) is the oldest currency in the world (886 AD) and the official currency of the United Kingdom. It is the fourth most traded currency unit in the world, accounting for 12% of all transactions and an average of $630 billion a day, as of 2022.
Its key currency pairs are GBP/USD, also known as the “Cable,” which accounts for 11% of the forex market, GBP/JPY, or the “Dragon” as it is known to traders (3%), and EUR/GBP (2%). The British Pound is issued by the Bank of England (BoE).
The most important factor influencing the value of the British Pound is the monetary policy decided by the Bank of England. The Bank of England bases its decisions on achieving its main objective of “price stability”, i.e. a stable inflation rate of around 2%. Its main tool for achieving this is the adjustment of interest rates.
When inflation is too high, the Bank of England tries to contain it by raising interest rates, making credit more expensive for individuals and businesses. This is generally positive for the GBP, as higher interest rates make the UK a more attractive place for global investors to park their money.
When inflation is too low, it is a sign that economic growth is slowing. In this scenario, the BoE will consider lowering interest rates to make credit cheaper, so that companies borrow more to invest in growth-generating projects.
The data released gauges the health of the economy and can influence the value of the Pound. Indicators such as GDP, manufacturing and services PMIs, and employment can influence the direction of the Pound.
A strong economy is good for the British Pound. Not only does it attract more foreign investment, but it may encourage the Bank of England to raise interest rates, which will directly strengthen the British Pound. Conversely, if economic data is weak, the British Pound is likely to fall.
Another significant indicator for the pound is the trade balance. This indicator measures the difference between what a country earns from its exports and what it spends on imports during a given period.
If a country produces highly sought-after exports, its currency will benefit exclusively from the additional demand created by foreign buyers who wish to purchase these goods. Therefore, a positive net trade balance strengthens a currency and vice versa for a negative balance.
Pound Sterling PRICE Today
The table below shows the exchange rate of the British Pound (GBP) against major currencies today. The British Pound was the strongest currency against the New Zealand Dollar.
| USD | EUR | GBP | JPY | CAD | AUD | NZD | CHF | |
|---|---|---|---|---|---|---|---|---|
| USD | -0.09% | -0.35% | 0.19% | -0.14% | -0.03% | 0.74% | 0.20% | |
| EUR | 0.09% | -0.25% | 0.32% | -0.03% | 0.05% | 0.81% | 0.29% | |
| GBP | 0.35% | 0.25% | 0.56% | 0.23% | 0.30% | 1.06% | 0.52% | |
| JPY | -0.19% | -0.32% | -0.56% | -0.31% | -0.24% | 0.49% | -0.03% | |
| CAD | 0.14% | 0.03% | -0.23% | 0.31% | 0.10% | 0.85% | 0.30% | |
| AUD | 0.03% | -0.05% | -0.30% | 0.24% | -0.10% | 0.75% | 0.20% | |
| NZD | -0.74% | -0.81% | -1.06% | -0.49% | -0.85% | -0.75% | -0.54% | |
| CHF | -0.20% | -0.29% | -0.52% | 0.03% | -0.30% | -0.20% | 0.54% |
The heatmap shows percentage changes of major currencies. The base currency is selected from the left column, while the quote currency is selected from the top row. For example, if you choose the British Pound from the left column and move along the horizontal line to the US Dollar, the percentage change shown in the chart will represent the GBP (base)/USD (quote).
Source: Fx Street
I am Joshua Winder, a senior-level journalist and editor at World Stock Market. I specialize in covering news related to the stock market and economic trends. With more than 8 years of experience in this field, I have become an expert in financial reporting.


