
- GBP/USD posts losses of 0.98%, paring almost all of Tuesday’s gains.
- UK inflation rises to 9%, up from 7% in the previous month.
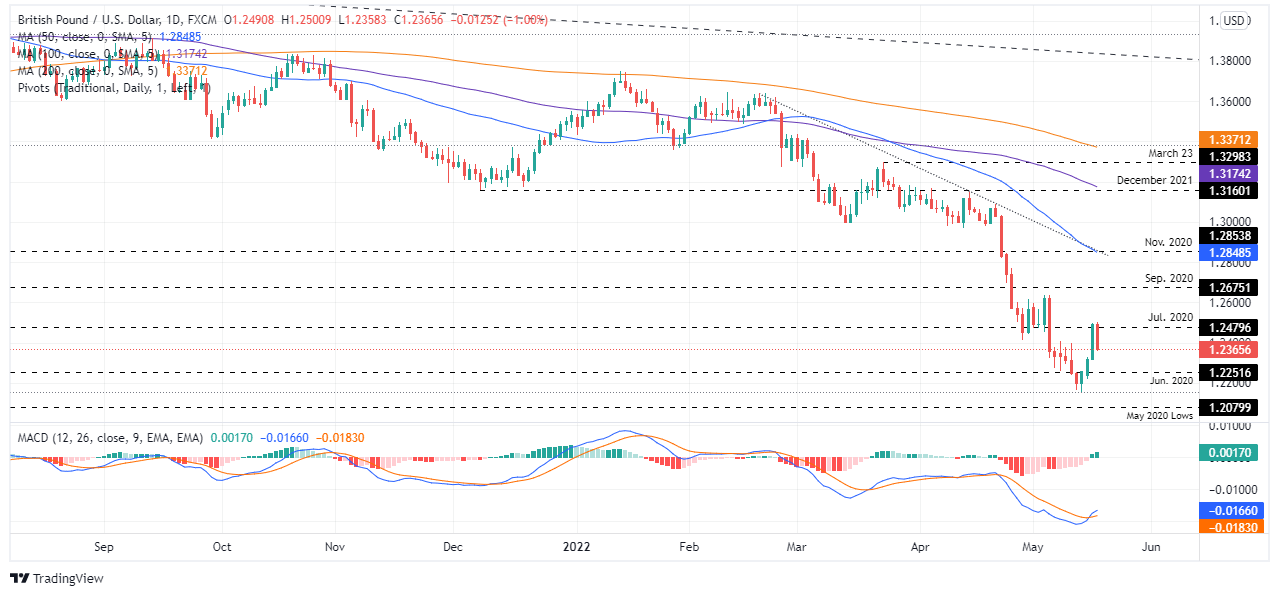
- GBP/USD Price Analysis: Still bearish bias and could retest year lows around 1.2155.
The GBP/USD it breaks three days of gains and lost nearly 1% during Wednesday’s session on a subdued mood in financial markets, even though reported UK inflation was higher than expected. At 1.2365, GBP/USD reflects a drop of more than 100 pips and almost a full reversal move since Tuesday.
Sentiment remains negative, another factor to consider when trading the British pound. Due to its status as a risk sensitive currency, when sentiment is negative, traders look to safe-haven pairs such as the dollar and yen. In addition, the pound sterling was affected by the high inflation figures and, according to the Bank of England, it could reach double digits throughout the year. This, together with the rise in rates by the central bank and lower growth, threatens to lead the British economy into stagflation. Consequently, the pound’s outlook looks cloudy and it could weaken further to May 2020 lows around 1.2080.
During the Asian session, GBP/USD opened near the highs around 1.2490 and tumbled when UK inflation was released, posting a new daily low around 1.2360.
GBP/USD Price Forecast: Technical Outlook
GBP/USD continues to have a bearish bias. The rally from year lows around 1.2150 was short-lived, and GBP/USD’s failure to recapture the July 2020 swing low turned resistance at 1.2479 exposed the major currency to further selling pressure. . Also, the slope of the MACD line is “almost” horizontal, which means that it could cross below the signal line, pointing lower, indicating that GBP/USD could extend its losses.
That said, the first GBP/USD support would be the May 17th daily low at 1.2315. A break below would expose the June 2020 lows around 1.2251, followed by the year’s low at 1.2155.
Technical levels
Source: Fx Street
With 6 years of experience, I bring to the table captivating and informative writing in the world news category. My expertise covers a range of industries, including tourism, technology, forex and stocks. From brief social media posts to in-depth articles, I am dedicated to creating compelling content for various platforms.


