
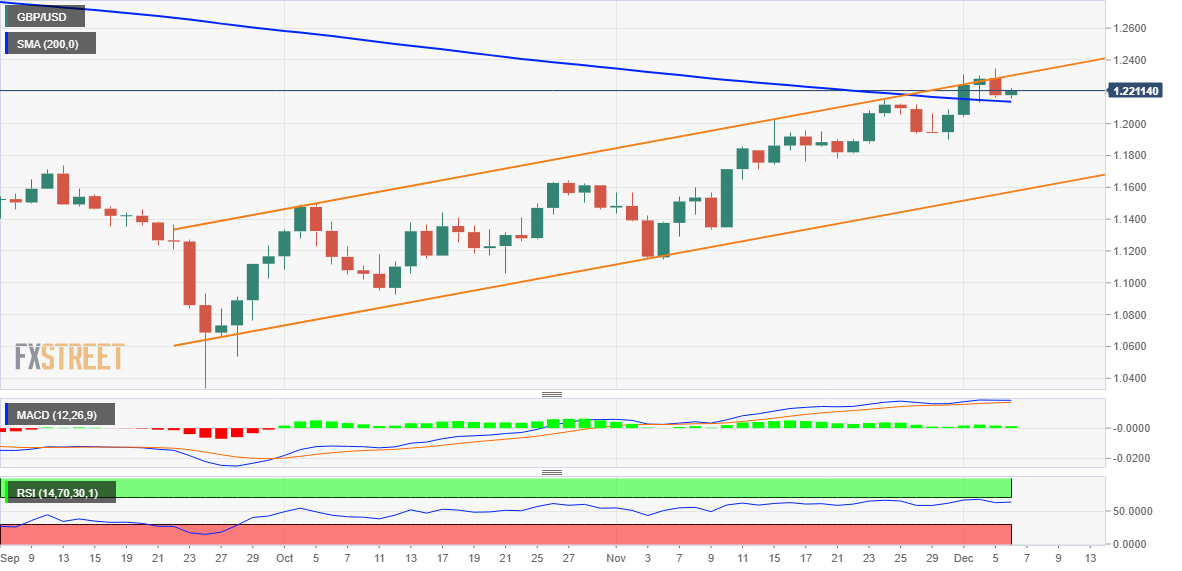
- GBP/USD attracts some buying near the 200-day SMA, though it lacks follow through.
- Overnight failure near trend channel resistance justifies caution for bulls.
- A sustained break below 1.2100 would pave the way for deeper losses.
The pair GBP/USD finds some support near the important 200-day SMA and halts the previous day’s pullback from its highest since June 17. However, the pair struggles to get any significant traction and is trading tepid gains to small losses around 1.2200 mid-European session.
The US dollar is struggling to take advantage of the strong overnight recovery move from lows in more than five months and it turns out to be a key factor supporting the GBP/USD pair. That being said, expectations that the Fed will raise interest rates more than anticipated is acting as a tailwind for the dollar. This, coupled with the gloomy outlook for the UK economy, prevents the pair from rising significantly.
From a technical point of view, last night’s failure near resistance marked by the upper end of a rising channel of more than two months could be seen as the first sign of bullish exhaustion. However, the lack of follow-up selling warrants some caution before confirming that GBP/USD may have made a near-term top and positioning for any significant corrective decline.
Meanwhile, the daily swing low around the 1.2160-1.2155 zone could act as immediate support ahead of the 200 DMA, currently around the 1.2135 region. This zone is followed by the 1.2100 level, which if broken decisively will leave GBP/USD vulnerable to weaken further to the 1.2000 psychological signal. The bearish trajectory could extend to the horizontal support of 1.1935-1.1930.
On the other hand, any significant intraday positive move could be hit by a hurdle near the 1.2250-1.2255 zone, above which GBP/USD could recover to 1.2300. Some follow-through buying should allow bulls to return to multi-month highs around the 1.2345 area touched on Monday. The pair could reach the trend channel barrier, currently around 1.2400.
GBP/USD daily chart
Key levels to watch
Source: Fx Street
I am Joshua Winder, a senior-level journalist and editor at World Stock Market. I specialize in covering news related to the stock market and economic trends. With more than 8 years of experience in this field, I have become an expert in financial reporting.


