
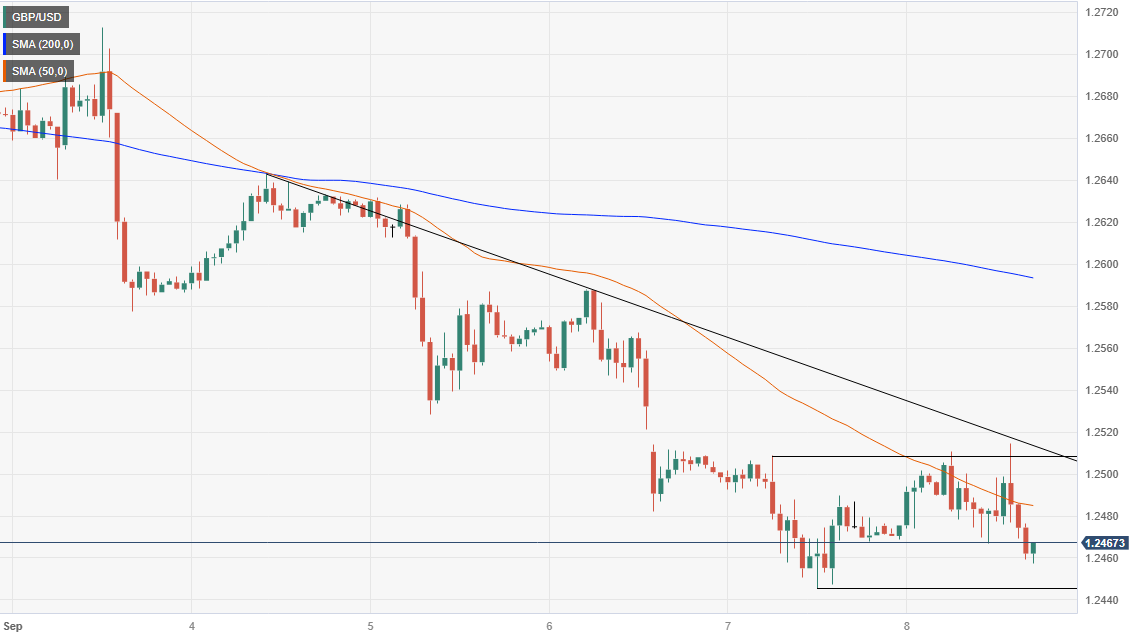
- GBP/USD falls to 1.2458 and puts the 200-day moving average at 1.2424 in focus.
- Short-term outlook shows the pair targeting the week’s low at 1.2455, with a break potentially aimed at the S2 daily pivot at 1.2413.
- Recovering the 1.2500 level could signal a bullish reversal, with next resistance at the 200-hour moving average at 1.2593.
The British Pound (GBP) prolonged its free fall for four consecutive days against the US dollar (USD) due to high US bond yields that support the Dollar. GBP/USD is trading at 1.2458 after hitting a daily high of 1.2514, as sellers eye technical support to extend their gains.
GBP/USD Price Analysis: Technical Perspective
After breaking a bullish support trend line drawn around the May lows, the pair fell below the psychological figure of 1.2500, which exposed the 200-day moving average (AMD) at 1.2424. Breaking the latter would change the pair’s bias to neutral to the downside and expose the May 25 low at 1.2308, a crucial support zone. This could break the bullish market structure and pave the way for further losses.
In the short term, the hourly chart of GPB/USD shows an attempt by buyers to reclaim the 1.2500 area. With buyers failing, the pair sank towards session lows, below Friday’s central pivot point, with an eye on the week’s low at 1.2455. Breaking this last point could expose the daily S2 pivot at 1.2413, followed by 1.2400. On the contrary, if traders reclaim 1.2500, it would open the door for further rises, with an eye on the 200 hourly moving average (HMA) at 1.2593 before challenging 1.2600.
GBP/USD Price Action – Hourly Chart
Source: Fx Street
I am Joshua Winder, a senior-level journalist and editor at World Stock Market. I specialize in covering news related to the stock market and economic trends. With more than 8 years of experience in this field, I have become an expert in financial reporting.


