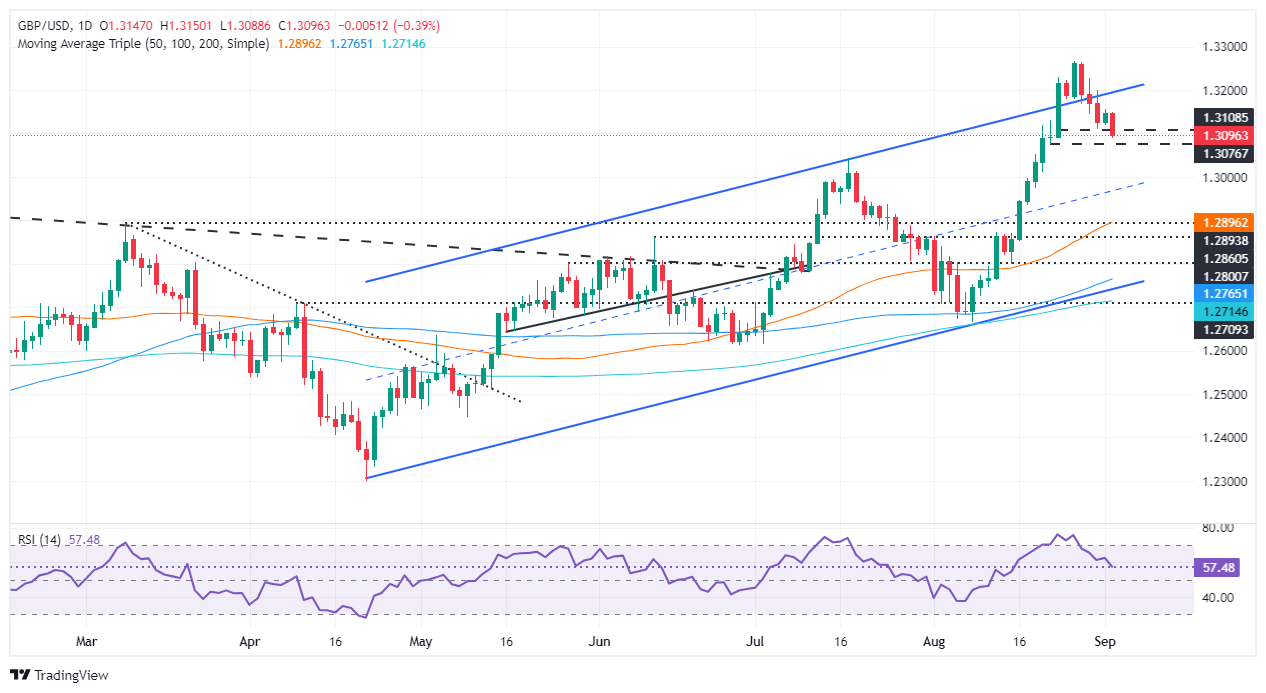
- GBP/USD drops below 1.3100 despite mixed RSI signals.
- The RSI tends to be bullish, but the momentum shifts in favor of sellers, falling towards neutral.
- A drop below 1.3100 could see GBP/USD test the July 17 high at 1.3043; further declines could reach the psychological level of 1.3000, then the 50-day moving average (DMA) at 1.2894.
- The uptrend will resume if GBP/USD sustains above 1.3100, surpassing the September 2 peak at 1.3155, targeting the channel top at 1.3200.
GBP/USD makes a U-turn, plummeting in early trading on Tuesday during the North American session, losing around 0.20% and trading at 1.3099, below the 1.3100 figure.
The US ISM manufacturing PMI for August missed estimates, suggesting the economy is cooling due to tight Fed policy. However, an employment subcomponent within the report showed a slight improvement, which could be a prelude to Friday’s nonfarm payrolls report.
GBP/USD Technical Outlook
GBP/USD fell sharply following the release of the data, on the verge of breaking the 1.3100 figure. The Relative Strength Index (RSI) remains bullish, but momentum has shifted in favor of sellers as the RSI is pointing lower, approaching its neutral level.
If GBP/USD drops below 1.3100, this could clear the way for a test of the July 17 high turned support at 1.3043. A drop below could see the pair test 1.3000, and if breached, the 50-day moving average (DMA) would be next at 1.2894.
If the bulls want to remain in charge, they need to keep GBP/USD above 1.3100. For a resumption of the uptrend, they need to surpass the September 2 peak at 1.3155 before challenging the upper trendline of the ascending channel at 1.3200.
GBP/USD Price Action – Daily Chart
Pound Sterling PRICE Today
The table below shows the exchange rate of the British Pound (GBP) against major currencies today. The British Pound was the strongest currency against the Australian Dollar.
| USD | EUR | GBP | JPY | CAD | AUD | NZD | CHF | |
|---|---|---|---|---|---|---|---|---|
| USD | 0.28% | 0.40% | -1.03% | 0.41% | 1.07% | 0.88% | -0.25% | |
| EUR | -0.28% | 0.11% | -1.30% | 0.13% | 0.78% | 0.50% | -0.57% | |
| GBP | -0.40% | -0.11% | -1.43% | 0.02% | 0.67% | 0.39% | -0.67% | |
| JPY | 1.03% | 1.30% | 1.43% | 1.45% | 2.12% | 1.74% | 0.75% | |
| CAD | -0.41% | -0.13% | -0.02% | -1.45% | 0.63% | 0.28% | -0.69% | |
| AUD | -1.07% | -0.78% | -0.67% | -2.12% | -0.63% | -0.39% | -1.33% | |
| NZD | -0.88% | -0.50% | -0.39% | -1.74% | -0.28% | 0.39% | -0.95% | |
| CHF | 0.25% | 0.57% | 0.67% | -0.75% | 0.69% | 1.33% | 0.95% |
The heatmap shows percentage changes of major currencies. The base currency is selected from the left column, while the quote currency is selected from the top row. For example, if you choose the British Pound from the left column and move along the horizontal line to the US Dollar, the percentage change shown in the chart will represent the GBP (base)/USD (quote).
Source: Fx Street
I am Joshua Winder, a senior-level journalist and editor at World Stock Market. I specialize in covering news related to the stock market and economic trends. With more than 8 years of experience in this field, I have become an expert in financial reporting.


