
- GBP/USD starts the week lower, struggling to stay above 1.3000.
- Sellers are targeting key support at last week’s low of 1.2973, with additional downside targets at the 100-day SMA and 200-day SMA, each at 1.2959 and 1.2796.
- Buyers must reclaim 1.3100 to challenge the 50-day SMA at 1.3133 and target the yearly high of 1.3434.
The British Pound is losing some ground against the Dollar. Rising tensions in the Middle East are fostering a risk-averse environment despite China’s efforts to boost its economy. At the time of writing, GBP/USD is trading at 1.2997, down 0.38%.
GBP/USD Price Forecast: Technical Outlook
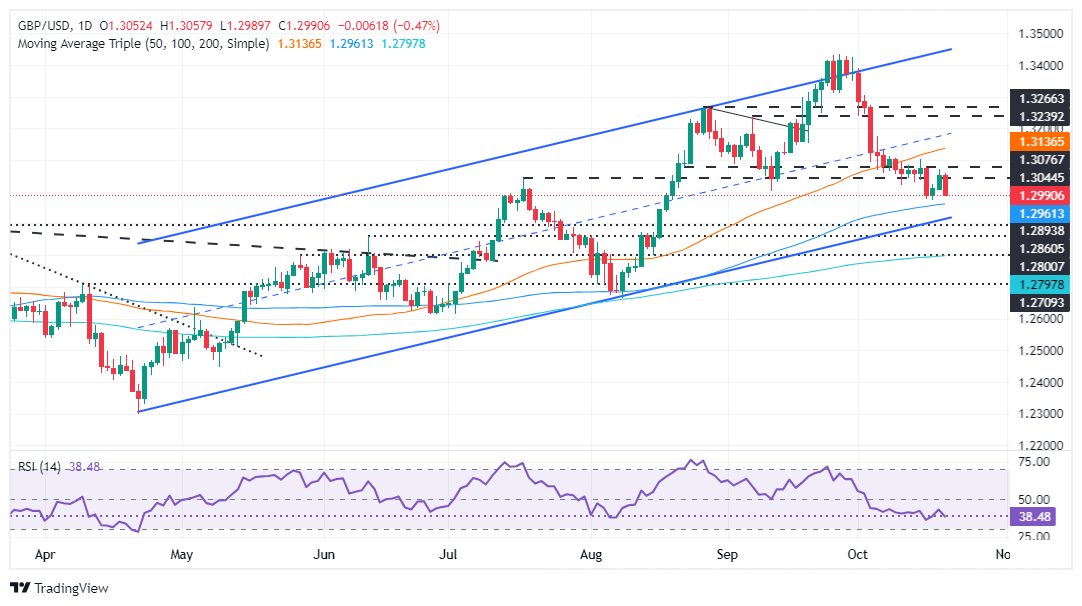
GBP/USD starts the week on the wrong foot after opening around 1.3039. Since then, the pair reached a high of 1.3057 before sliding below the 1.3000 mark.
The momentum suggests that the sellers are in charge, as shown by the Relative Strength Index (RSI). However, they must overcome last week’s low of 1.2973 before challenging the 100-day moving average (SMA) at 1.2959, aiming to push prices towards the 200-day SMA at 1.2796.
On the other hand, buyers must lift the GBP/USD spot price above 1.3100 so that it can test the 50-day SMA at 1.3133 as it prepares to challenge the yearly high (YTD) at 1.3434.
GBP/USD Price Action – Daily Chart
Pound Sterling PRICE Today
The table below shows the percentage change of the British Pound (GBP) against major currencies today. Pound sterling was the strongest currency against the Australian dollar.
| USD | EUR | GBP | JPY | CAD | AUD | NZD | CHF | |
|---|---|---|---|---|---|---|---|---|
| USD | 0.34% | 0.47% | 0.47% | 0.19% | 0.64% | 0.54% | 0.14% | |
| EUR | -0.34% | 0.06% | 0.03% | -0.09% | 0.27% | 0.09% | -0.30% | |
| GBP | -0.47% | -0.06% | -0.02% | -0.27% | 0.18% | 0.07% | -0.40% | |
| JPY | -0.47% | -0.03% | 0.02% | -0.27% | 0.17% | 0.12% | -0.40% | |
| CAD | -0.19% | 0.09% | 0.27% | 0.27% | 0.35% | 0.40% | -0.20% | |
| AUD | -0.64% | -0.27% | -0.18% | -0.17% | -0.35% | -0.03% | -0.60% | |
| NZD | -0.54% | -0.09% | -0.07% | -0.12% | -0.40% | 0.03% | -0.47% | |
| CHF | -0.14% | 0.30% | 0.40% | 0.40% | 0.20% | 0.60% | 0.47% |
The heat map shows percentage changes for major currencies. The base currency is selected from the left column, while the quote currency is selected from the top row. For example, if you choose the British Pound from the left column and move along the horizontal line to the US Dollar, the percentage change shown in the box will represent the GBP (base)/USD (quote).
Source: Fx Street
I am Joshua Winder, a senior-level journalist and editor at World Stock Market. I specialize in covering news related to the stock market and economic trends. With more than 8 years of experience in this field, I have become an expert in financial reporting.

 before falling asleep improves sleep quality: confirmation is scientific")


