
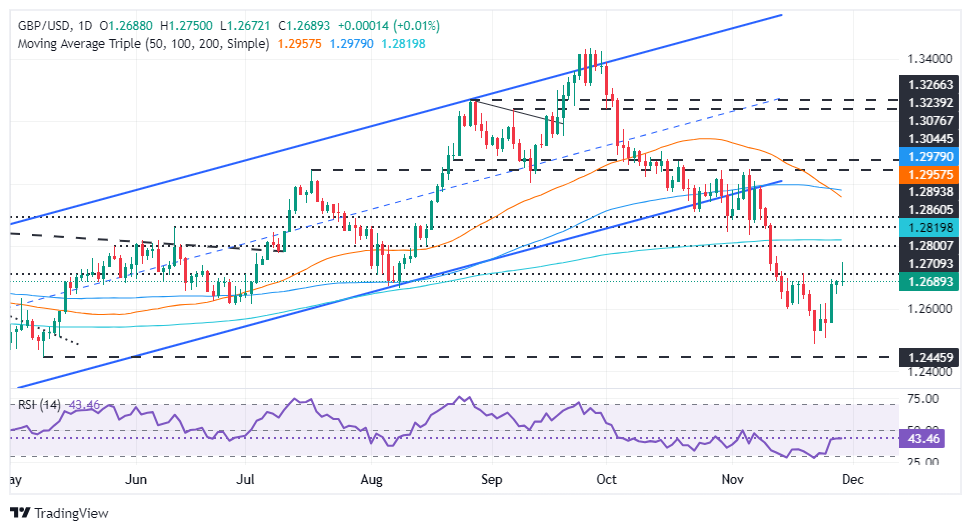
- GBP/USD sees a weekly gain of over 1.2% but faces resistance near 1.2700, risking a pullback to 1.2600.
- Oscillators like the RSI suggest growing buying momentum, but remain below the neutral threshold.
- Breaking above 1.2700 could target the 200-day SMA at 1.2818, with this week’s high at 1.2749 as an immediate hurdle.
The British Pound is holding on to earlier gains but trading below weekly highs, which reached around 1.2749 during the European session. At the time of writing, GBP/USD is trading at 1.2684, virtually unchanged.
GBP/USD Price Forecast: Technical Outlook
Although GBP/USD is poised for weekly gains of over 1.2%, the price action suggests that Cable did not find acceptance above 1.2700, which could exacerbate a pullback towards 1.2600. In that case, the next support for the pair would be the November 27 daily low of 1.2564, followed by the November 26 low of 1.2506. On further weakness, the Nov 22 pivot low of 1.2486 is in the cards.
Conversely, if GBP/USD ends the week above 1.2700, this could pave the way to test the 200-day SMA at 1.2818. However, buyers must overcome the current week’s peak of 1.2749.
Oscillators like the Relative Strength Index (RSI) hint that buyers are gaining momentum, although the RSI remains below its neutral line.
Therefore, in the short term, GBP/USD is seen rising if it breaks 1.2700.
GBP/USD Price Chart – Daily
Pound Sterling PRICE Today
The table below shows the percentage change of the British Pound (GBP) against major currencies today. Pound sterling was the strongest currency against the Canadian dollar.
| USD | EUR | GBP | JPY | CAD | AUD | NZD | CHF | |
|---|---|---|---|---|---|---|---|---|
| USD | 0.06% | -0.01% | -0.93% | 0.07% | -0.12% | -0.44% | -0.08% | |
| EUR | -0.06% | -0.06% | -1.01% | 0.01% | -0.18% | -0.50% | -0.14% | |
| GBP | 0.00% | 0.06% | -0.97% | 0.07% | -0.12% | -0.44% | -0.08% | |
| JPY | 0.93% | 1.01% | 0.97% | 1.02% | 0.81% | 0.48% | 0.86% | |
| CAD | -0.07% | -0.01% | -0.07% | -1.02% | -0.20% | -0.51% | -0.15% | |
| AUD | 0.12% | 0.18% | 0.12% | -0.81% | 0.20% | -0.32% | 0.04% | |
| NZD | 0.44% | 0.50% | 0.44% | -0.48% | 0.51% | 0.32% | 0.36% | |
| CHF | 0.08% | 0.14% | 0.08% | -0.86% | 0.15% | -0.04% | -0.36% |
The heat map shows percentage changes for major currencies. The base currency is selected from the left column, while the quote currency is selected from the top row. For example, if you choose the British Pound from the left column and move along the horizontal line to the US Dollar, the percentage change shown in the box will represent the GBP (base)/USD (quote).
Source: Fx Street
I am Joshua Winder, a senior-level journalist and editor at World Stock Market. I specialize in covering news related to the stock market and economic trends. With more than 8 years of experience in this field, I have become an expert in financial reporting.


