
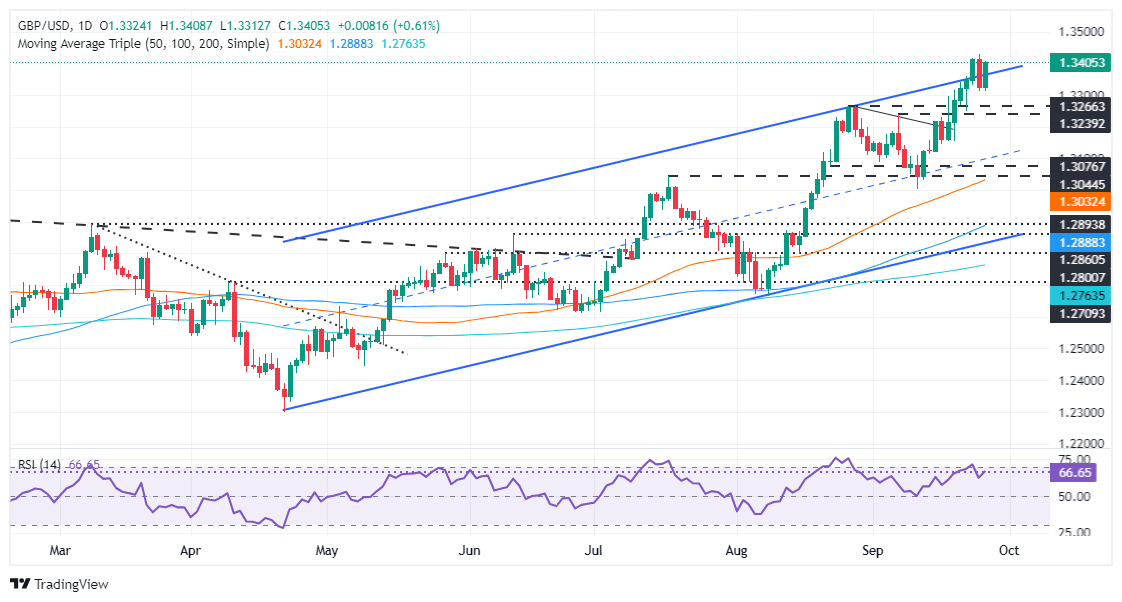
- GBP/USD is up 0.59%, trading at 1.3394 after rebounding from a daily low of 1.3312.
- Breaking above 1.3400 could push the pair towards the yearly high of 1.3437 and further resistance at 1.3500.
- Failure to reclaim 1.3400 may lead to a test of the September 25 low of 1.3312.
The British Pound is up more than 0.59% against the US Dollar, boosted by an improvement in risk appetite, sponsored by China’s stimulus to its economy and increasing chances of a ‘soft landing’ in the US following the release of robust economic data. GBP/USD is trading at 1.3394 after bouncing from daily lows of 1.3312.
GBP/USD Price Forecast: Technical Outlook
GBP/USD resumed its uptrend after falling below the upper trendline of an ascending channel, which, in the short term, was a sign of sellers’ strength. However, buyers emerged around the week’s lows and lifted the exchange rate higher. Still, it remains shy of the crucial figure of 1.3400, today’s high.
If GBP/USD reclaims 1.3400, the next resistance will be the 1.3429-1.3437 area, the confluence of the current year-to-date (YTD) high and the daily high of March 1, 2022, followed by 1.3450. With further strength, 1.3500 will emerge as the next key resistance level.
Conversely, GBP/USD failure at 1.3400 will sponsor a test of September 25 daily low of 1.3312. A decisive break will expose August 27 high turned support at 1.3266, followed by September 23 low of 1.3248.
GBP/USD Price Action – Daily Chart
Pound Sterling PRICE Today
The table below shows the exchange rate of the British Pound (GBP) against major currencies today. The British Pound was the strongest currency against the Japanese Yen.
| USD | EUR | GBP | JPY | CAD | AUD | NZD | CHF | |
|---|---|---|---|---|---|---|---|---|
| USD | -0.36% | -0.61% | 0.04% | -0.06% | -0.93% | -0.89% | -0.40% | |
| EUR | 0.36% | -0.26% | 0.39% | 0.30% | -0.57% | -0.53% | -0.04% | |
| GBP | 0.61% | 0.26% | 0.64% | 0.56% | -0.31% | -0.29% | 0.23% | |
| JPY | -0.04% | -0.39% | -0.64% | -0.08% | -0.97% | -0.95% | -0.44% | |
| CAD | 0.06% | -0.30% | -0.56% | 0.08% | -0.86% | -0.83% | -0.33% | |
| AUD | 0.93% | 0.57% | 0.31% | 0.97% | 0.86% | 0.05% | 0.54% | |
| NZD | 0.89% | 0.53% | 0.29% | 0.95% | 0.83% | -0.05% | 0.50% | |
| CHF | 0.40% | 0.04% | -0.23% | 0.44% | 0.33% | -0.54% | -0.50% |
The heatmap shows percentage changes of major currencies. The base currency is selected from the left column, while the quote currency is selected from the top row. For example, if you choose the British Pound from the left column and move along the horizontal line to the US Dollar, the percentage change shown in the chart will represent the GBP (base)/USD (quote).
Source: Fx Street
I am Joshua Winder, a senior-level journalist and editor at World Stock Market. I specialize in covering news related to the stock market and economic trends. With more than 8 years of experience in this field, I have become an expert in financial reporting.


