
- GBP/USD breaks above 1.3140, gaining short-term momentum as RSI tilts in favor of buyers.
- Breaking above 1.3200 opens the door to challenge the yearly peak of 1.3266, with further resistance at 1.3300.
- Sellers need to push below 1.3140 to test key support levels at 1.3100 and 1.3043.
The British Pound enjoyed a good bounce from the weekly low of 1.3087 and is higher in early trade on Wednesday during the North American session, gaining more than 0.22% against the Dollar. Soft US jobs data increased the chances of a 50 basis point rate cut by the Federal Reserve and supported GBP/USD higher, trading at 1.3163.
GBP/USD Price Forecast: Technical Outlook
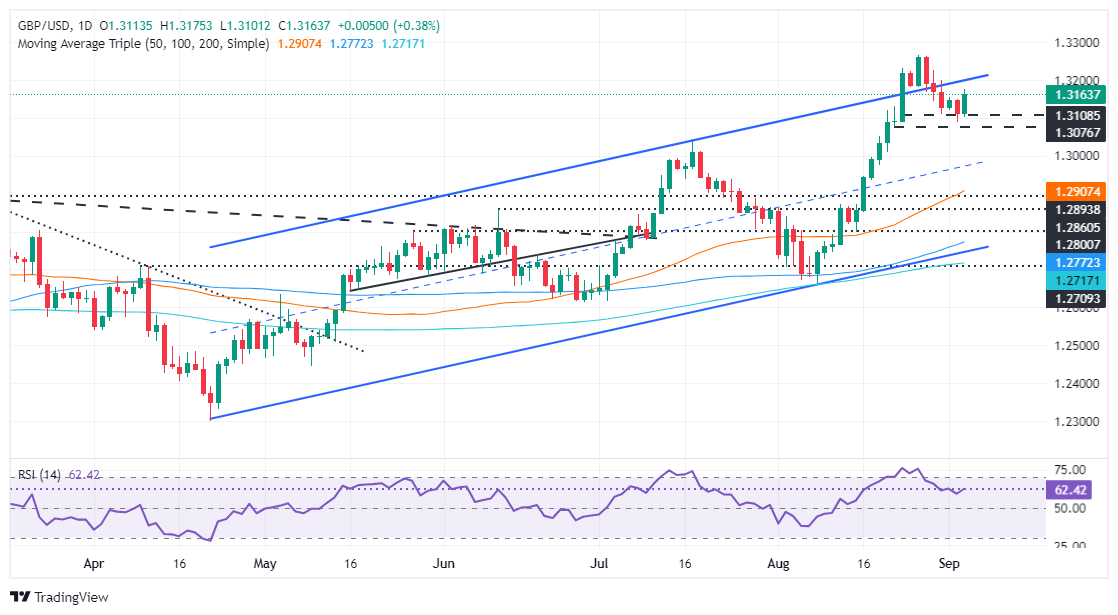
GBP/USD remains biased higher after consolidating within the tight range of 1.3080-1.3140, with buyers overcoming the latter, which would open the door for higher prices. Buyers had gained momentum in the short term as shown by the Relative Strength Index (RSI).
If the bulls overcome 1.3200, the next resistance would be the yearly high of 1.3266. On further strength, the 1.3300 level would be available before the buyers challenge the March 23, 2022 high of 1.3437.
On the contrary, sellers need to drag prices below 1.3140 and challenge the 1.3100 figure. Once those levels are overcome, the next support would be 1.3043, the July 17 high turned support, followed by the 1.3000 figure, and the 50-day moving average (DMA) would be next at 1.2905.
GBP/USD Price Action – Daily Chart
Pound Sterling PRICE Today
The table below shows the exchange rate of the British Pound (GBP) against major currencies today. The British Pound was the strongest currency against the US Dollar.
| USD | EUR | GBP | JPY | CAD | AUD | NZD | CHF | |
|---|---|---|---|---|---|---|---|---|
| USD | -0.38% | -0.39% | -0.95% | -0.34% | -0.47% | -0.38% | -0.24% | |
| EUR | 0.38% | 0.00% | -0.51% | 0.06% | -0.08% | 0.03% | 0.14% | |
| GBP | 0.39% | -0.01% | -0.49% | 0.05% | -0.09% | 0.04% | 0.12% | |
| JPY | 0.95% | 0.51% | 0.49% | 0.55% | 0.41% | 0.50% | 0.64% | |
| CAD | 0.34% | -0.06% | -0.05% | -0.55% | -0.15% | -0.02% | 0.07% | |
| AUD | 0.47% | 0.08% | 0.09% | -0.41% | 0.15% | 0.11% | 0.23% | |
| NZD | 0.38% | -0.03% | -0.04% | -0.50% | 0.02% | -0.11% | 0.10% | |
| CHF | 0.24% | -0.14% | -0.12% | -0.64% | -0.07% | -0.23% | -0.10% |
The heatmap shows percentage changes of major currencies. The base currency is selected from the left column, while the quote currency is selected from the top row. For example, if you choose the British Pound from the left column and move along the horizontal line to the US Dollar, the percentage change shown in the chart will represent the GBP (base)/USD (quote).
Source: Fx Street
I am Joshua Winder, a senior-level journalist and editor at World Stock Market. I specialize in covering news related to the stock market and economic trends. With more than 8 years of experience in this field, I have become an expert in financial reporting.


