
- GBP/USD faces a 0.12% loss, weighed down by high US Treasury yields and global trade apprehensions.
- US Existing Home Sales fell 2.2% in July; limited inventory and high mortgage rates are cited as causes.
- The Richmond Fed’s manufacturing index meets expectations at -7, while the services index surprises at a positive 4.
GBP/USD pulled back after testing the 50-day moving average (DMA), but fell mainly on higher US Treasury yields and risk aversion spurred by recent events in China. Fears that the country with the world’s second-largest economy could slow sharply could weigh on world trade. Therefore, the GBP/USD pair is trading at 1.2741, registering losses of 0.12% at the time of writing this report.
US Stocks Down, Dollar Strengthens: Global Trade Tensions Rise with China Economic Uncertainties
US stocks experience a pullback due to fragile sentiment in the markets. The National Association of Realtors (NAR) released data indicating a 2.2% decline in Existing Home Sales for July. However, this represents an improvement compared to the previous month’s figure of -3.3%. NAR chief economist Lawrence Yun attributed this decline to factors such as limited “inventory availability” and high “mortgage rates,” according to the report.
Other data revealed by the Richmond Fed, the manufacturing index plunged -7 as expected in August, although its services index beat estimates for a contraction of -4, standing at 4.
US bond yields are mixed, as the short end of the curve continues to drop, while the 10, 20 and 30 fall between 0.18 and 0.47%. However, the dollar continues to rise, and the Dollar Index (DXY), which measures the value of the dollar against six currencies, advanced 0.26% to 103.588.
In recent remarks by Richmond Fed President Thomas Barkin, he stressed that the change in yields does not indicate “inappropriate” tightening in markets. Instead, he sees it as a reaction to strong economic data. Barkin further stated that if inflation remains high and the economy continues to show signs of strength, it would strengthen the case for further tightening.
In the US, the economic agenda will include Fed interventions, S&P Global PMIs, durable goods orders and new home sales.
Meanwhile, in the UK, the S&P Global/CIPS PMI indices are due to be released, which are expected to weaken further in both services and manufacturing. The manufacturing PMI is expected to fall for six consecutive months, while the services PMI is expected to rise to 51.3.
GBP/USD Price Analysis: Technical Perspective
GBP/USD is bias neutral but is trading within the 50-day moving average (DMA) and 1.2600 month to date. A bullish resumption would follow once buyers recapture the 1.2800 level, exacerbating a rally towards 1.3000, with 1.2900 seen as initial resistance. Conversely, if GBP/USD falls below 1.2600, it could expose GBP/USD to selling pressure. Key support levels to test would be 1.2500, followed by the 200 DMA at 1.2387.
GBP/USD Price Action – Daily Chart
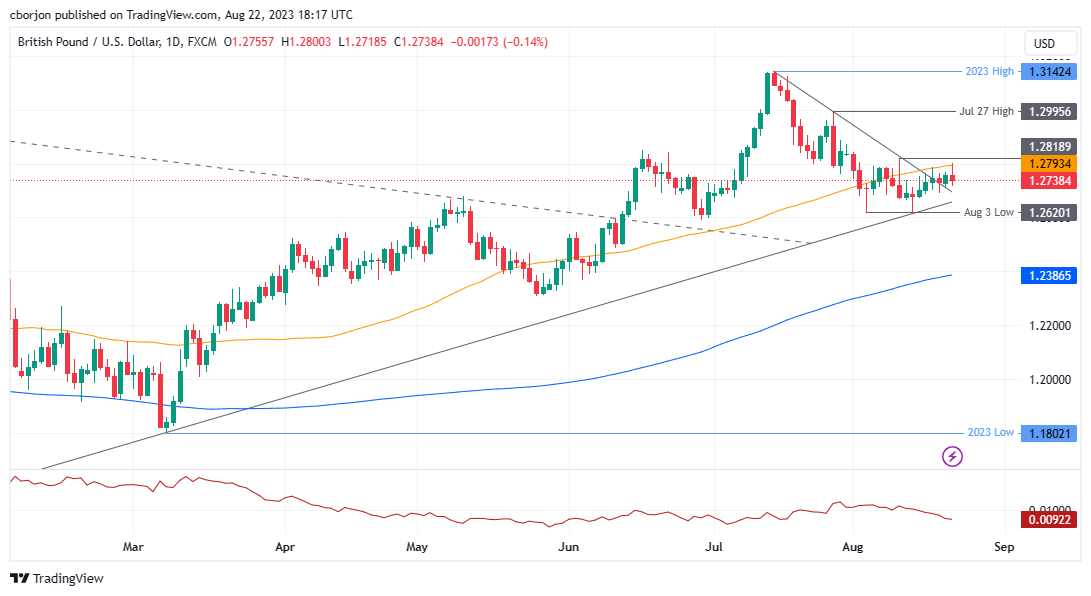
Source: Fx Street
I am Joshua Winder, a senior-level journalist and editor at World Stock Market. I specialize in covering news related to the stock market and economic trends. With more than 8 years of experience in this field, I have become an expert in financial reporting.


