
- GBP/USD breaks three consecutive weeks of losses, and stands around 1.34%.
- The US S&P Global PMIs show purchasing managers’ concern about current US economic conditions.
- The US 2yr-10yr yield curve remains inverted for 14 consecutive days.
The GBP/USD retraces 1.2000 level amid weak market mood as equities are swinging lately, due to US S&P Global PMI data showing contraction in services sector and its composite index, while traders seek safety in US Treasuries, with falling US bond yields undermining the dollar.
The GBP/USD pair is trading at 1.2028 after falling towards its daily low around 1.1915. However, the currency recovered and reached a daily high of 1.2063 before stabilizing at current levels.
US PMIs show signs of further deterioration
Meanwhile, the US PMI indices (S&P Global) released data for July. Manufacturing rose 52.3, above expectations, but services and composite fell to 47 and 47.6, respectively, suggesting the economy is deteriorating, the survey found. On hearing the news, the dollar index, a basket of pairs that measures the behavior of the dollar, falls 0.18% and stands at 106,407, while the US 10-year yield plummets ten basis points to the 2,789%.
Traders should note that the US 2s-10s yield curve remains inverted at -0.174%, indicating an impending recession. However, the 3-month to 10-year yield curve in the US has flattened towards the 0.367% zone, which, although positive, has been erased from its peak in May at 2,350%, almost 200 basic points.
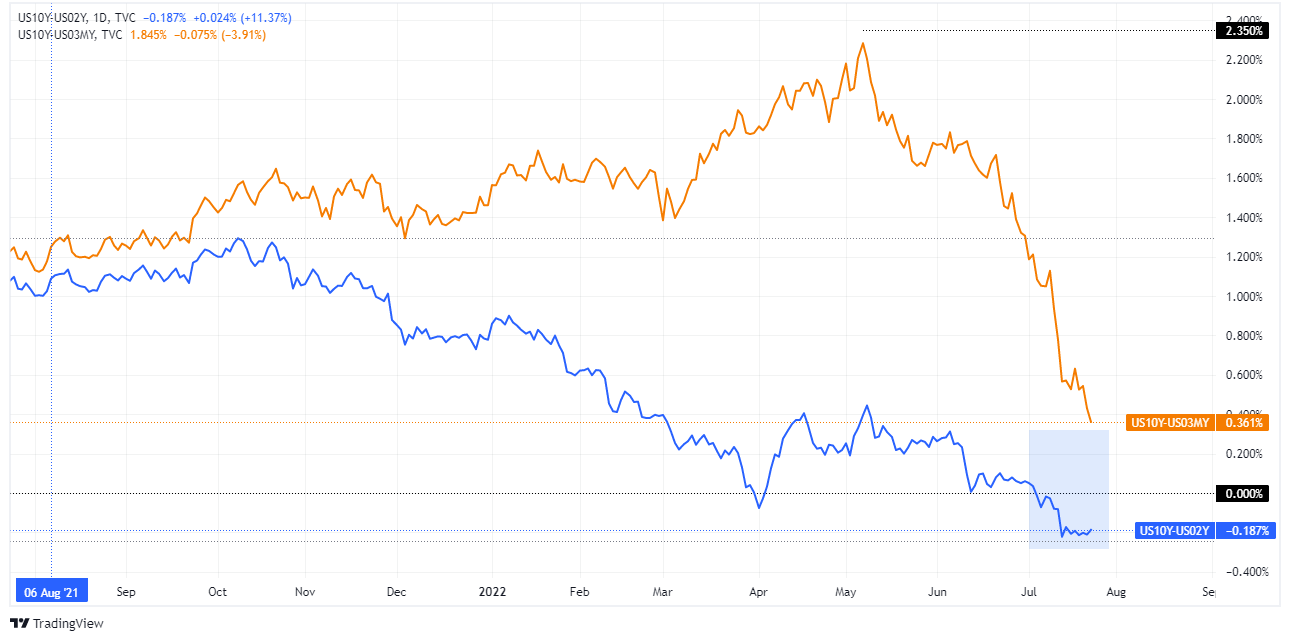
2 years 10 years of USA in blue – 3 months -10 years of USA in orange
Meanwhile, in the UK, UK retail sales contracted, showing the pressure of high prices in the UK. June sales fell -5.8% yoy, more than estimates, while the monthly reading contracted -0.1%, less than the -0.3% contraction estimated.
Later in the day, UK global PMIs for July remained above expansion territory, easing some pressure on the shoulders of Bank of England (BoE) Governor Andrew Bailey. However, the political issues surrounding the resignation of incumbent Prime Minister Boris Johnson are keeping the British busy with the battle between Rishi Sunak and Liz Truss. This coupled with Brexit jitters could cap any bullish reaction in GBP/USD.
What to watch out for
Next week, an absent UK economic docket would keep GBP/USD traders supported by US economic data. On the US calendar, the Federal Reserve Open Market Committee’s (FOMC) monetary policy decision, US inflation data and second quarter gross domestic product on their forward reading will keep traders in the GBP/USD glued to their screens.
GBP/USD key technical levels
Source: Fx Street
With 6 years of experience, I bring to the table captivating and informative writing in the world news category. My expertise covers a range of industries, including tourism, technology, forex and stocks. From brief social media posts to in-depth articles, I am dedicated to creating compelling content for various platforms.


