
- The lack of a new catalyst kept the pound within known ranges.
- A mixed market mood, fueled by rising global bond yields, capped GBP/USD’s gains.
- GBP/USD Price Forecast: Still tilted to the downside, but a test towards 1.2300 is in the offing.
The British pound is still trading in a tight range against the dollar, although it is still trading with minimal gains after testing the 12300 level reaching daily highs at 1.2313, followed by a drop towards daily lows near 1.2238. In 1.2277, the GBP/USD rises 0.05% in the American session.
The market mood is mixed as US equities fluctuate between gains and losses. GBP/USD remains almost flat in the absence of a catalyst, leaving traders adrift from last week’s news and sentiment. Last Friday, the chief economist of the Bank of England, Huw Pill, said that interest rates would be the main tool of monetary policy, as the bank prepares to start its quantitative tightening.
Considering that inflation in the UK reached its highest level in 40 years, at 9.1%, analysts expect the central bank to raise rates by 25 basis points in August. The Bank of England’s Monetary Policy Committee is due to consider the bond sale plan at the same meeting, after which it could decide to launch the asset sale.
Meanwhile, global bond yields, which had fallen on the session as recession fears faded, rose, turning market sentiment to mixed. That said, the 10-year US Treasury yield is up six basis points, yielding 3,200%-.
Meanwhile, the US Dollar Index, a measure of the dollar’s value against its peers, eased a bit on Monday, down 0.18%, again below 104,000.
In the UK, Bank of England statements will be released on Tuesday, with Jon Cunliffe. Across the pond, the US docket will include BC Consumer Confidence for June, estimated at 100.4, down from 106.4 in May, along with Wholesale Inventories, Trade Balance, regional index reports from the Fed and Fed speakers.
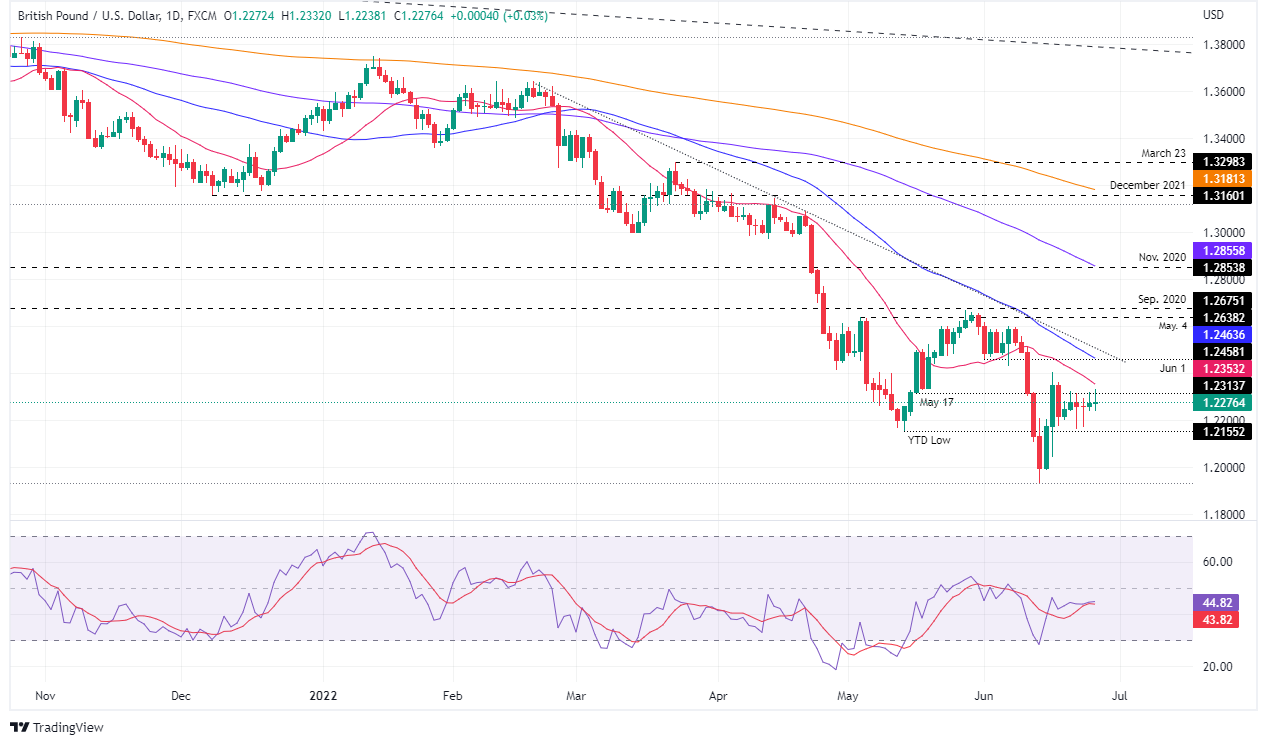
GBP/USD Price Forecast: Technical Outlook
Consolidation is what the GBP/USD daily chart is showing, inside the 1.2150-1.2300 zone, although it is biased to the downside. The confirmation of the above are the exponential moving averages (EMA), above the exchange rate, while the Relative Strength Index (RSI), at 44.97, remains in bearish territory.
For GBP/USD buyers to regain control, they must take back 1.2500. However, on their way up, they would face resistance at 1.2300. Once broken, the 50 EMA at 1.2353 would be the next level to challenge, followed by the June 16 high at 1.2405, and then the 100 EMA at 1.2463.
On the path of least resistance to the major, the first support would be 1.2200. A break below would expose the June 22 daily low at 1.2160, followed by 1.2000.
Technical levels
Source: Fx Street
With 6 years of experience, I bring to the table captivating and informative writing in the world news category. My expertise covers a range of industries, including tourism, technology, forex and stocks. From brief social media posts to in-depth articles, I am dedicated to creating compelling content for various platforms.


