
- The United Kingdom CPI rises to 3.6% year -on -year in April, well above the inflation target of 2% of the BOE.
- The underlying inflation is accelerated to 3.8%, generating doubts about future rate cuts.
- The US dollar collapses while the G-7 enlivens the speculation that Washington favors a weaker dollar.
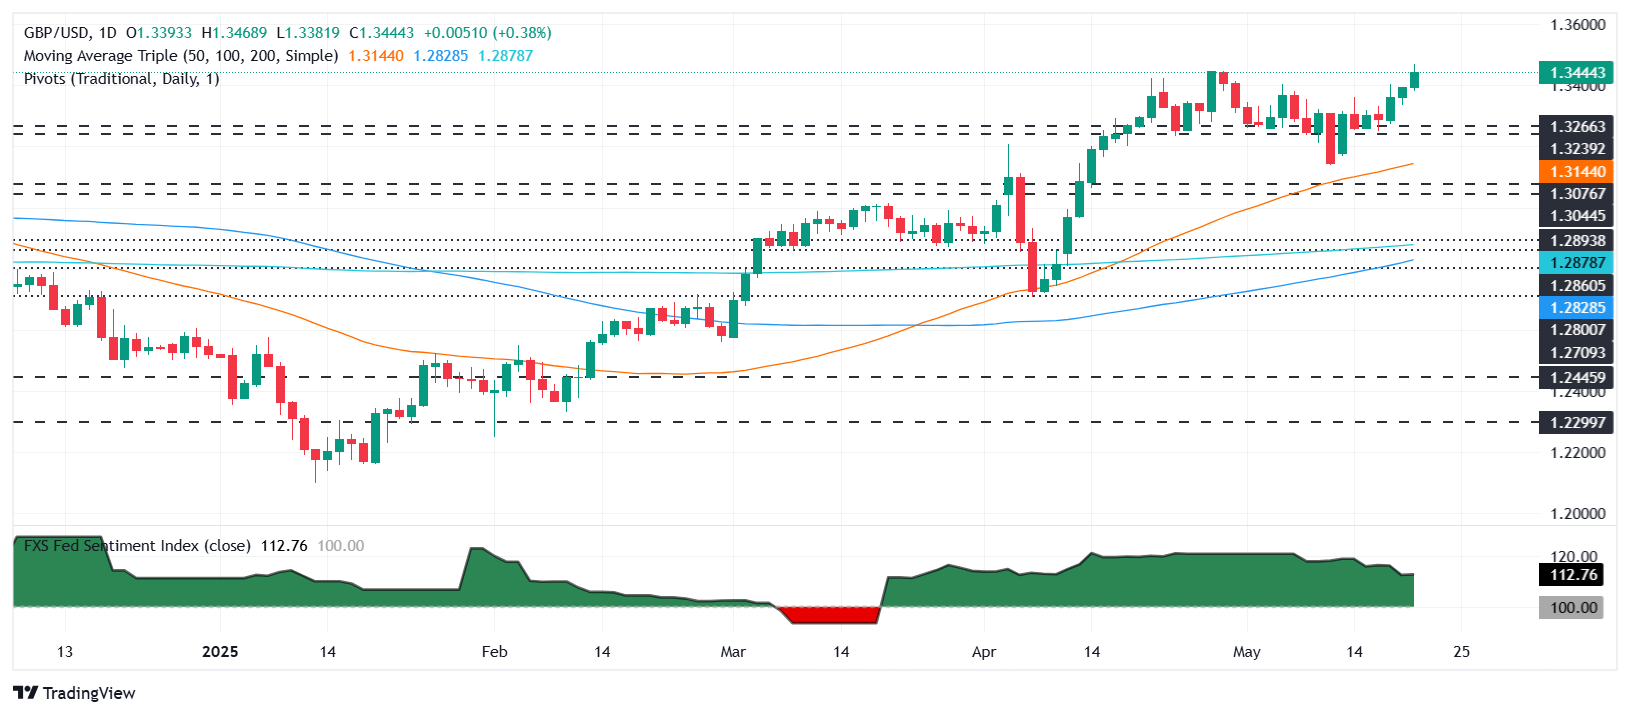
The sterling pound rose to a new maximum of the year (YTD) of 1,3468 against the US dollar on Wednesday, since the inflation of the United Kingdom increased, moving away from the 2% target of the Bank of England (BOE), which had led to reductions of interest rates at the beginning of the month. At the time of writing, the GBP/USD quotes at 1,3446, rising 0.40%.
The United Kingdom inflation exceeds the forecasts, derailing the relaxation path of the BOE and raising the USD/USD over 1.34 while the dollar weakens
The data of the United Kingdom have set aside the intentions of the BOE to continue reducing interest rates in future meetings. The Consumer Price Index (CPI) in April rose 3.6% year -on -year, from 2.6% in March, the National Statistics Office (ONS) revealed. The underlying IPC increased by 3.8% year -on -year, exceeding the increase of 3.4% in March.
On the data, the United Kingdom Finance Minister Rachel Reeves commented in a statement that was disappointed and added: “I know that the pressures of the cost of living continue to weigh on the workers.”
Increases in water, gas and electricity invoices contributed to the highest consumer inflation. It should be noted that analysts expected an IPC of 3.3% and a underlying inflation of 3.6%, both figures above the impression of the previous month.
Futures of the money market are discounting only 35 basic points (PB) of relaxation by the Bank of England (BOE) towards the end of the year.
On the other side of the Atlantic, the discussions about the “One Big Beautiful Bill” of President Trump continued. The president of the US House of Representatives, Mike Johnson, declared that they had completed the discussions about Salt and indicated that a vote on the floor on the tax bill on Thursday remains realistic.
Meanwhile, the dollar continues to weaken, since the US dollar index (DXY), which tracks the value of the US dollar in front of a basket of six currencies, falls 0.52% to 99.50.
A G-7 meeting in Canada has increased speculation that the Trump administration is looking for a weaker US dollar to reduce the commercial deficit. According to Bloomberg, the local media in South Korea reported that the Won Korean (KRW) was discussed in commercial negotiations with the USA.
This week, the economic agenda of the United Kingdom will include preliminary PMIs and speakers of the BOE. In the US, the operators will be attentive to the PMIs and the initial applications of unemployment subsidy for the end week, speeches of the Fed and housing data.
GBP/USD price forecast: technical perspective
The gBP/USD bullish trend continued as the torque reached a new peak of the year. The impulse remains bullish, as indicated by the relative force index (RSI), which exceeded the last peak above 60, with sufficient space before reaching overcompra conditions.
That said, the first key level of resistance of the GBP/USD would be 1,3468, followed by the figure of 1.35. If it is exceeded, the next stop would be the maximum of February 18, 2022 in 1,3642.
On the contrary, if the GBP/USD falls below 1,340, the following support would be 1,3350, followed by 1,3300. Key support levels are below the latter in 1,3250, 1,3200 and the single mobile average (SMA) of 50 days in 1,3141.
LIBRA ESTERLINA PRICE THIS WEEK
The lower table shows the percentage of sterling pound (GBP) compared to the main currencies this week. Libra sterling was the strongest currency against the US dollar.
| USD | EUR | GBP | JPY | CAD | Aud | NZD | CHF | |
|---|---|---|---|---|---|---|---|---|
| USD | -1.35% | -1.17% | -1.15% | -1.01% | -0.94% | -1.35% | -1.39% | |
| EUR | 1.35% | 0.16% | 0.26% | 0.41% | 0.55% | 0.06% | -0.03% | |
| GBP | 1.17% | -0.16% | -0.19% | 0.24% | 0.39% | -0.10% | -0.19% | |
| JPY | 1.15% | -0.26% | 0.19% | 0.14% | 0.37% | -0.01% | -0.19% | |
| CAD | 1.01% | -0.41% | -0.24% | -0.14% | 0.08% | -0.35% | -0.44% | |
| Aud | 0.94% | -0.55% | -0.39% | -0.37% | -0.08% | -0.48% | -0.55% | |
| NZD | 1.35% | -0.06% | 0.10% | 0.00% | 0.35% | 0.48% | -0.09% | |
| CHF | 1.39% | 0.03% | 0.19% | 0.19% | 0.44% | 0.55% | 0.09% |
The heat map shows the percentage changes of the main currencies. The base currency is selected from the left column, while the contribution currency is selected in the upper row. For example, if you choose the sterling pound from the left column and move along the horizontal line to the US dollar, the percentage change shown in the box will represent the GBP (base)/USD (quotation).
Source: Fx Street
I am Joshua Winder, a senior-level journalist and editor at World Stock Market. I specialize in covering news related to the stock market and economic trends. With more than 8 years of experience in this field, I have become an expert in financial reporting.


