
- The US dollar falls sharply after the publication of US inflation data.
- US inflation cooled to 3.2% in October; the core CPI decreases to 4.1%.
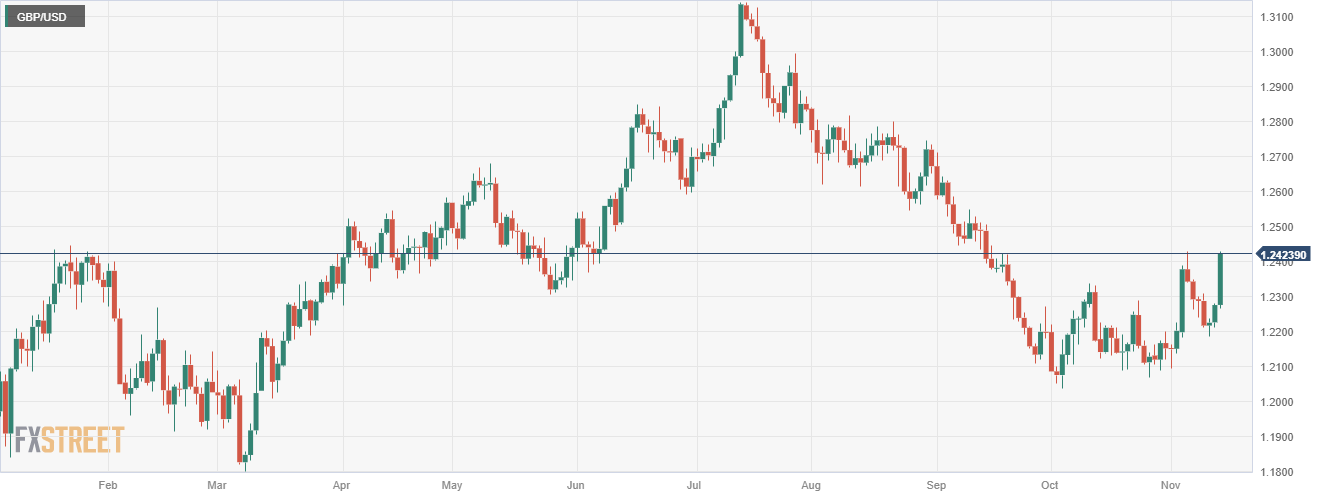
- GBP/USD rises strongly, gaining more than 130 pips in a few minutes.
The GBP/USD pair has gone from trading just below the 1.2300 level to rising above 1.2420 in just a few minutes following the release of US Consumer Price Index (CPI) figures for October, which came in below The expectations. The Dollar Index has dropped sharply and has fallen below 104.80, reaching its lowest level since September 20.
US inflation cools, as do Fed rate hike expectations
The US CPI was unchanged in October, defying expectations of a 0.1% increase, following a 0.4% rise in September. The annual inflation rate fell slightly from 3.7% in September to 3.2% in October, below the market consensus of 3.3%. Core CPI, which excludes volatile food and energy prices, rose 0.2% monthly, below market expectations of 0.3%. The annual core CPI inflation rate stood at 4.1%, slightly below the 4.2% recorded the previous month.
Following the release of the data, the probability of a rate hike in December fell to virtually 0% from 14% previously, according to the CME’s FedWatch tool. The swaps market is now predicting the possibility of the first rate cut again in June next year, up from the previous forecast in July.
US Treasury yields saw a significant decline following the report, falling more than 3%. The 10-year yield fell from 4.62% to 4.50%. Meanwhile, Wall Street stock markets hit new weekly highs.
The combination of a weaker US dollar, lower Treasury yields and improving risk appetite pushed the GBP/USD pair above 1.2400. At the time of writing, the pair is at daily highs near 1.2430, up over 1.20% on the day, testing November highs and highest levels since mid-September.
GBP/USD daily chart
GBP/USD technical levels to watch
Source: Fx Street
I am Joshua Winder, a senior-level journalist and editor at World Stock Market. I specialize in covering news related to the stock market and economic trends. With more than 8 years of experience in this field, I have become an expert in financial reporting.


