
- GBP/USD is forming a bearish candlestick pattern with bearish implications.
- US private hiring and business activity estimates as economic growth slows.
- Business activity in the UK expands, although inflation remains in double digits.
He GBP/USD faces strong resistance around 1.2500 and pulls back on risk aversion as investors assess a possible US recession. The latest US economic data paints a bleak picture, which the US Federal Reserve (Fed) already anticipates, as the last piece of the puzzle, the labor market, showed signs of slowing down. GBP/USD is trading at 1.2459, shedding 0.33%.
US stocks continue to fall across the board. The ISM released its non-manufacturing index, which rose 51.2, below estimates and data from the previous month. Earlier, private hiring in the US, as reported by ADP in collaboration with the Stanford Digital Economy Lab, rose to 145,000, below the consensus of 200,000.
Following the release of the figures, GBP/USD oscillated in a wide 70-point range between 1.2505 and 1.2432, before stabilizing around 1.2450. As business activity slows, recessionary fears are mounting among investors.
On the other hand, money market futures continued to anticipate that the US central bank, the Federal Reserve (Fed), would keep rates unchanged at its May meeting.
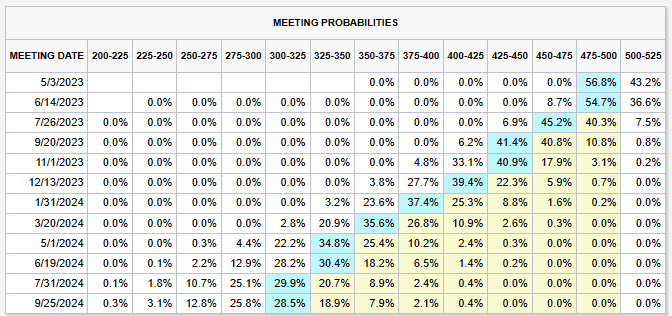
Source: CME FedWatch Tool
Aside from this, the UK economic calendar included the S&P Global/CIPS Services PMI, which came in at 52.9, coming in below estimates but in expansionary territory. However, in fundamental terms, inflation in the UK remains in double digits, although according to the latest Bank of England (BoE) Monetary Policy Report (MPI), the central bank expected inflation to fall “significantly in the second quarter of 2023”. That being said, investors have begun pricing in a less hawkish BoE, and by the next policy meeting, the odds of no change stand at 54.5%.
GBP/USD Technical Analysis
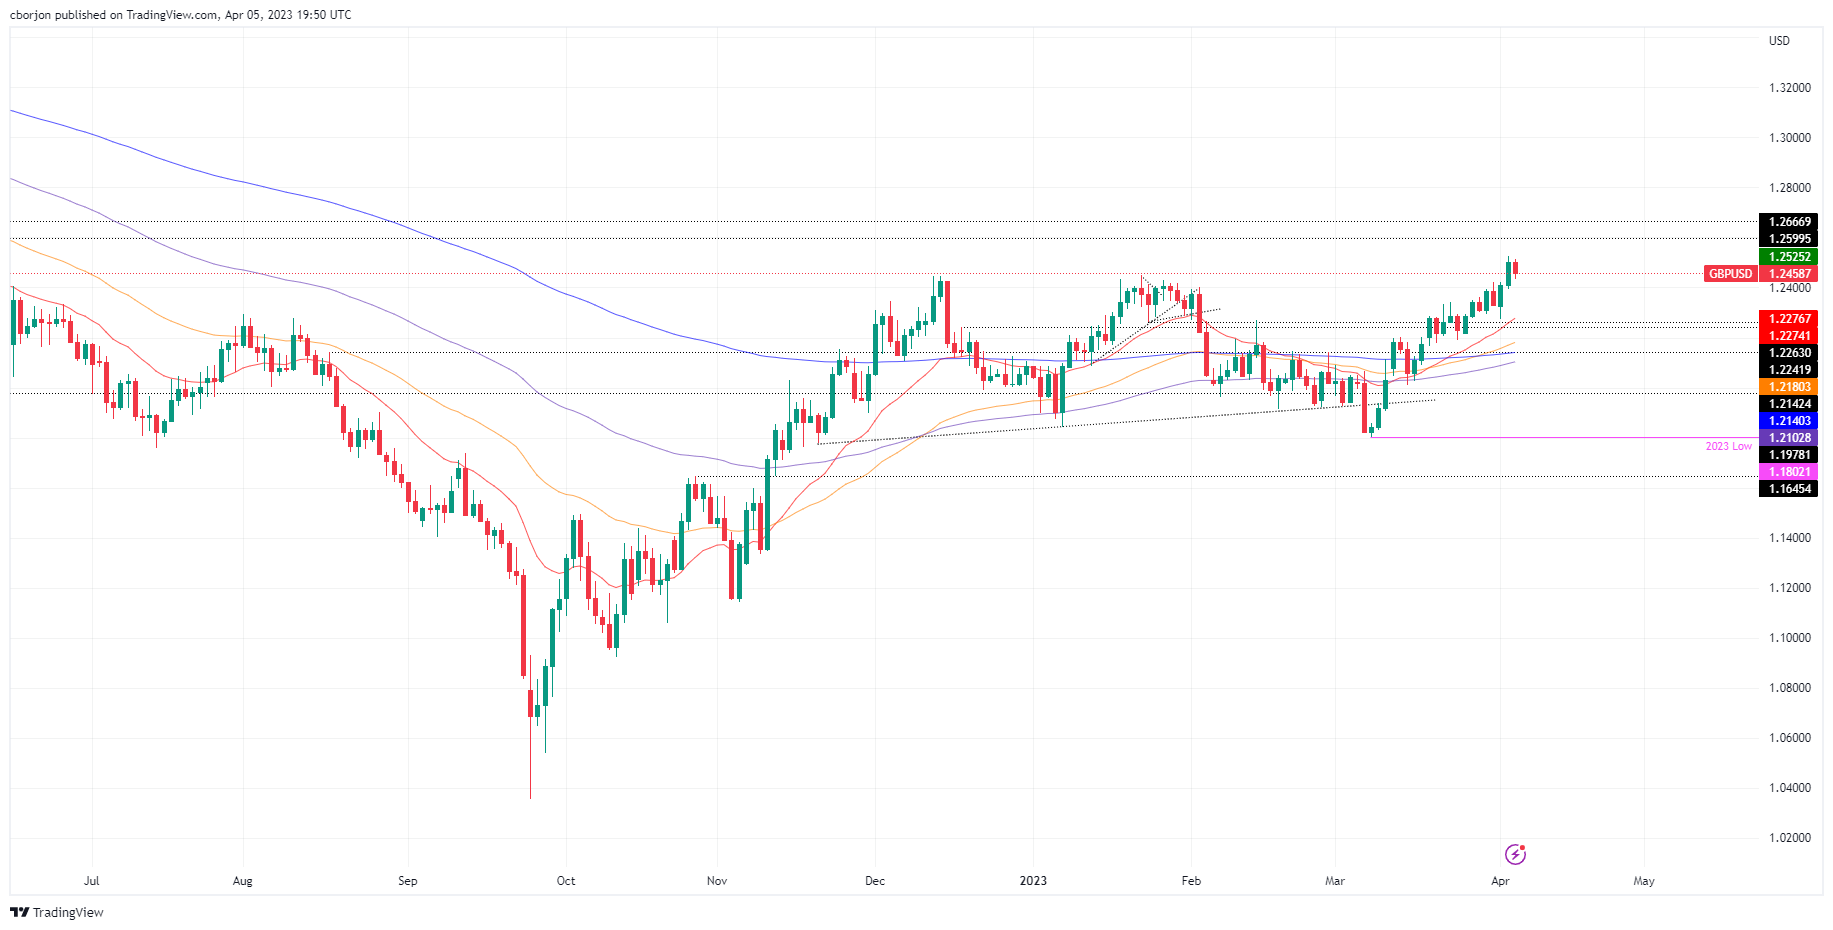
From a technical point of view, the GBP/USD pair seems to have peaked around 1.2500. A daily close at current exchange rates would confirm the formation of a bearish two-bar pattern, suggesting further declines are in store. If GBP/USD breaks below Tuesday’s low at 1.2394, next support for the pair would be the 20-day EMA at 1.2276, followed by the psychological signal at 1.2200. Downside risks at the 50 day EMA.
Source: Fx Street
I am Joshua Winder, a senior-level journalist and editor at World Stock Market. I specialize in covering news related to the stock market and economic trends. With more than 8 years of experience in this field, I have become an expert in financial reporting.


