
- Sterling is holding on to weekly gains of 0.42% amid political turmoil and Brexit fears.
- The risk-off environment, and high US bond yields, buoyed the dollar and weighed on the pound sterling.
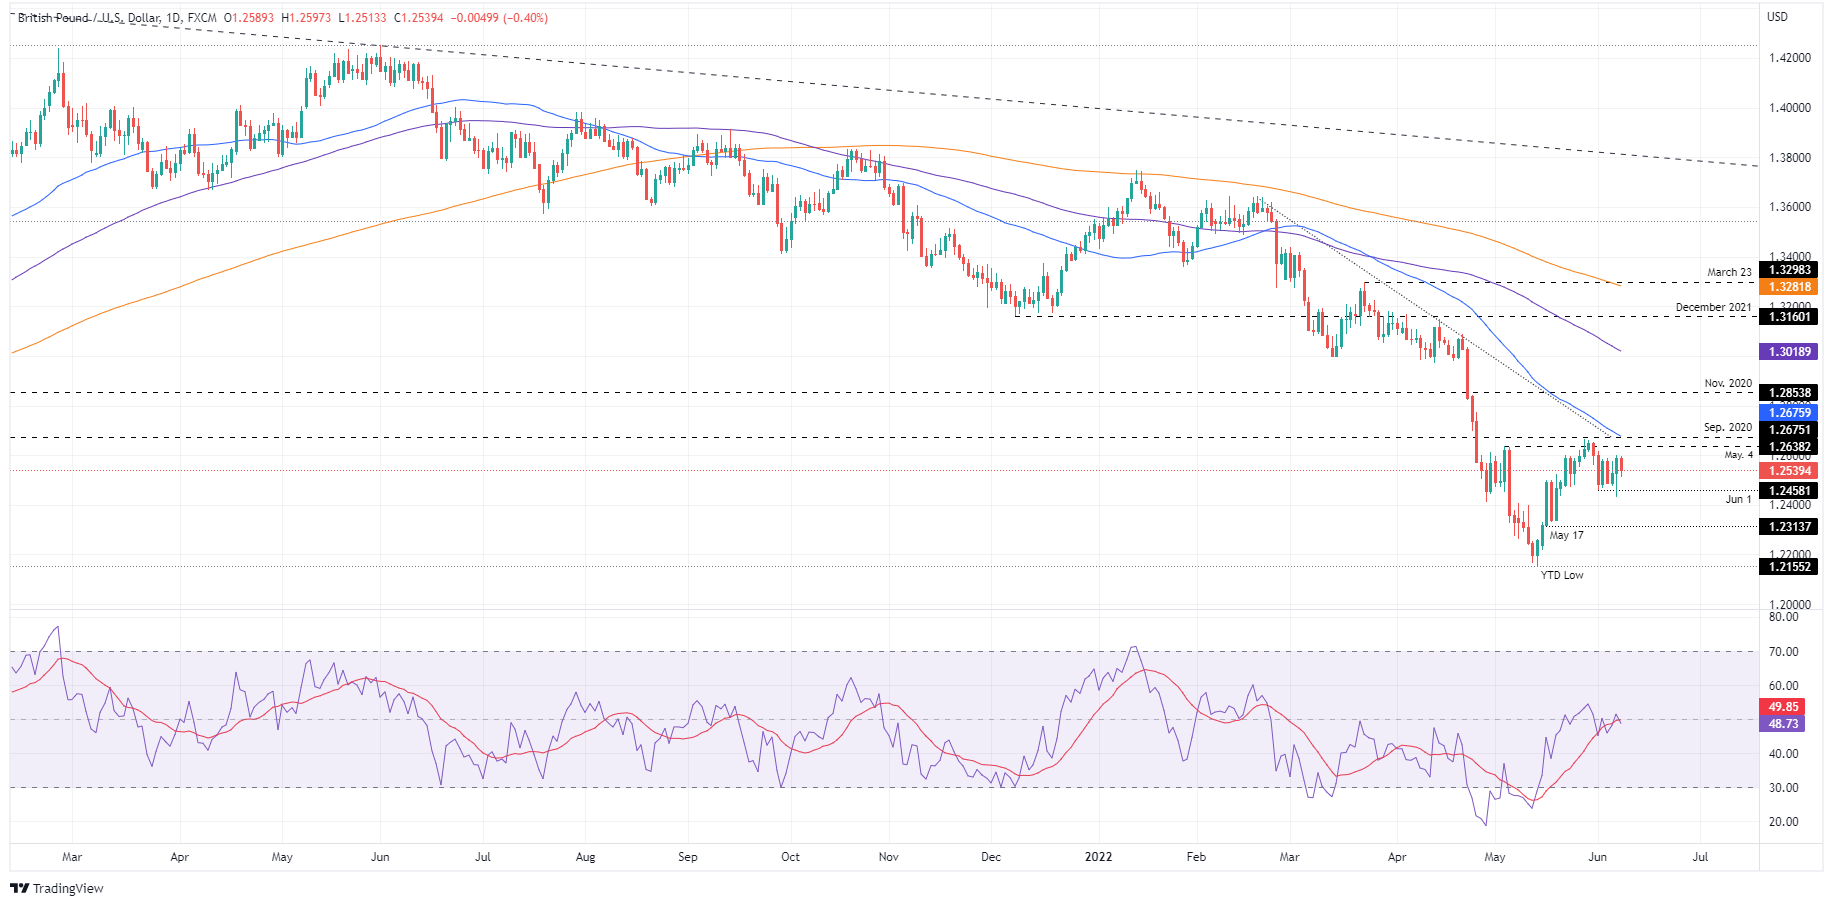
- GBP/USD Price Forecast: Remains neutral to the downside, although a daily close below 1.2500 will see the pair drop towards 1.2400.
The GBP/USD remains in a consolidation phase, within the 1.2450-1.2670 area, below the 50-day moving average (DMA) at 1.2676 for the eighth consecutive day, as risk aversion increased the demand for the USD. At 1.2539, the GBP/USD mirrors the above in the American session.
Risk aversion and high US Treasury yields weighed on the GBP
Wall Street is set to end the day with a loss as high US Treasury yields weigh on stocks. Furthermore, it underpins the USD as the dollar index posts gains of 0.18% to settle at 102.517. In the bond market, the US 10-year Treasury bond yield rose five basis points to 3,029%. Thus, the main causes of the GBP’s decline are those mentioned above, along with the current economic slowdown in the UK, as the Bank of England prepares for another rate hike, despite the stagflation scenario.
On Wednesday, GBP/USD managed to open near session highs at 1.2597. However, since the beginning of the day, the pound fell towards daily lows around 1.2513, followed by a jump towards the 200 hour simple moving average (SMA) at 1.2565. Late in the American session, the pound settled around the daily pivot at 1.2540.
Meanwhile, the OECD cut the global economic outlook for 2022 and 2023. The organization expects the global economy to grow 3.0% year-on-year in 2022, down from the 4.5% estimate. Previous expectations stood at 3.2% for 2023, although the OECD expects growth to reach 2.8% per year.
The UK economic docket will not include top-tier economic data in the week ahead. By contrast, the US calendar will feature Initial Jobless Claims, Consumer Inflation Report and UoM Consumer Sentiment.
GBP/USD Price Forecast: Technical Outlook
Despite the ongoing correction, which lifted sterling from current year lows of 1.2155 to 1.2670, the pound remains neutrally biased to the downside. Confirming the above, the Relative Strength Index (RSI), at 48.76, despite being in bearish territory, lacks momentum to drag GBP/USD lower.
In the short term, the first resistance for GBP/USD would be the 50-day moving average (DMA) at 1.2675. On the other hand, the first bid zone for GBP/USD would be 1.2500, followed by the June 7 low at 1.2430, and then 1.2400.
Technical levels
Source: Fx Street
With 6 years of experience, I bring to the table captivating and informative writing in the world news category. My expertise covers a range of industries, including tourism, technology, forex and stocks. From brief social media posts to in-depth articles, I am dedicated to creating compelling content for various platforms.


