
- GBP/USD is falling on the day, with massive selling.
- UK November CPI inflation fell more than expected.
- The Pound finds some relief in declining demand for the US Dollar.
GBP/USD capped below 1.2680 after UK Consumer Price Index (CPI) inflation came in below expectations and caused the British Pound (GBP) to fall against the US Dollar (USD), dragging the pair through the 1.2720 zone and touching 1.2630.
The British Pound was easily the worst performing currency against the rest of the major currencies on Wednesday, losing around 0.50% after a lukewarm recovery from the day’s lows, which saw it rise to just below 1.2680 .
UK Core CPI missed market expectations early on Wednesday. November CPI inflation rose 5.1% year over year, below the 5.6% expected by the market, up from 5.7% annualized in October.
Monthly CPI inflation unexpectedly fell and stood at -0.2%, compared to the 0.1% expected by the market, while in October it remained stable at 0.0% month-on-month.
Sales of existing homes in the US improved in November, helping to reinforce risk appetite in the markets and pushing the dollar lower, supporting the British pound and halting the day’s declines in the GBP/ USD. Existing home sales in the US showed 3.82 million pre-existing homes changed hands, above the forecast of 3.77 million and rebounding from October’s print of 3.79 million.
US consumer confidence also improved, showing that consumers are cautiously optimistic about the economic outlook through December. The Consumer Economic Expectations Index rose to 110.7 from 101.0 in November (revised slightly downward from 102.0).
The second half of the week will continue on Thursday with the US Gross Domestic Product (GDP) growth figures, which are expected to remain at 5.2% in the third quarter, followed on Friday by the price index of the US Personal Consumption Expenditure (PCE), as well as third quarter UK GDP and retail sales.
Third quarter British GDP is expected to remain stable at 0.0%, while November British retail sales are expected to have improved from -0.3% to 0.4%.
US PCE numbers are expected to remain stable at 0.2% MoM in November.
GBP/USD Technical Outlook
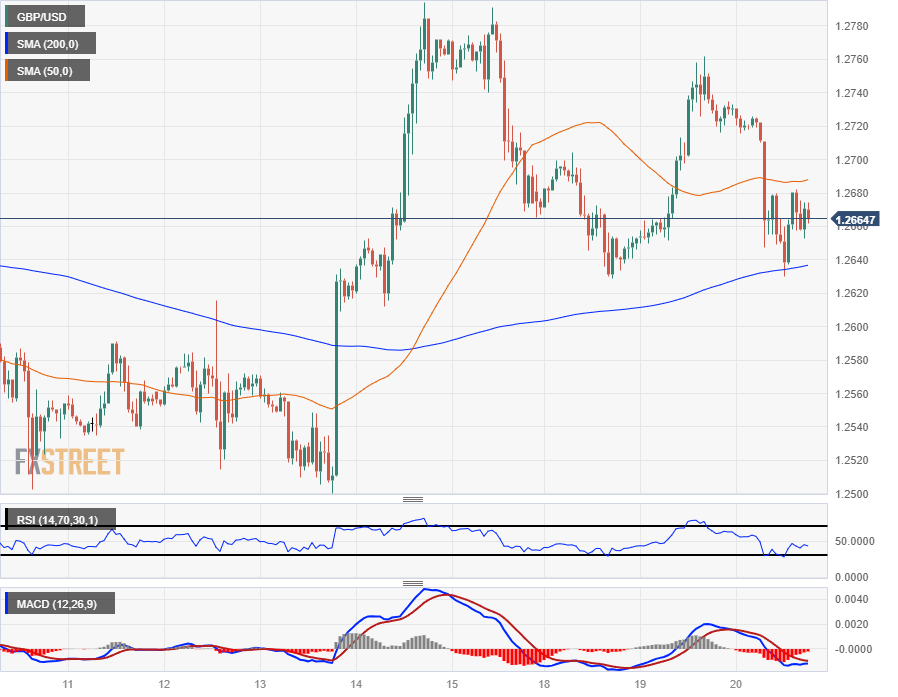
The fall of the British pound against the US dollar took the GBP/USD pair to the 200 hourly SMA near 1.2635, and a tepid bounce limits the pair in the midrange between the 200 hourly SMA and the 50-hour SMA near 1.2690.
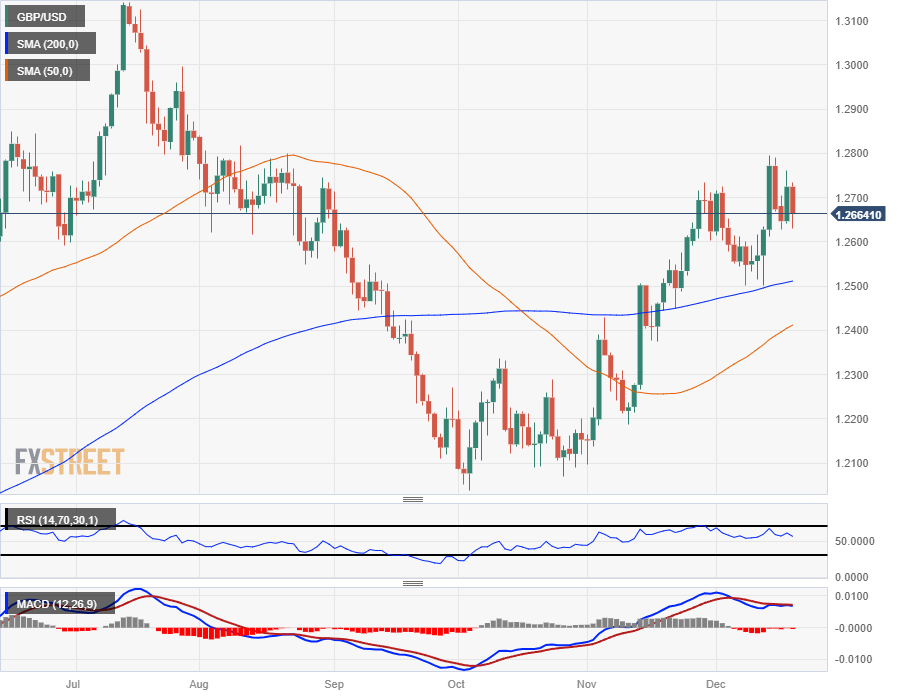
GBP/USD is still above the 200-day SMA on daily candles, but a lack of bullish momentum is causing the pair to fall from recent highs to the 1.2800 area, with a pullback at risk of a bearish extension towards low territory near the 50-day SMA at the 1.2400 area.
GBP/USD 1-hour chart
GBP/USD daily chart
GBP/USD technical levels
Source: Fx Street
I am Joshua Winder, a senior-level journalist and editor at World Stock Market. I specialize in covering news related to the stock market and economic trends. With more than 8 years of experience in this field, I have become an expert in financial reporting.


