
- The pound under pressure, among the worst results of the American session.
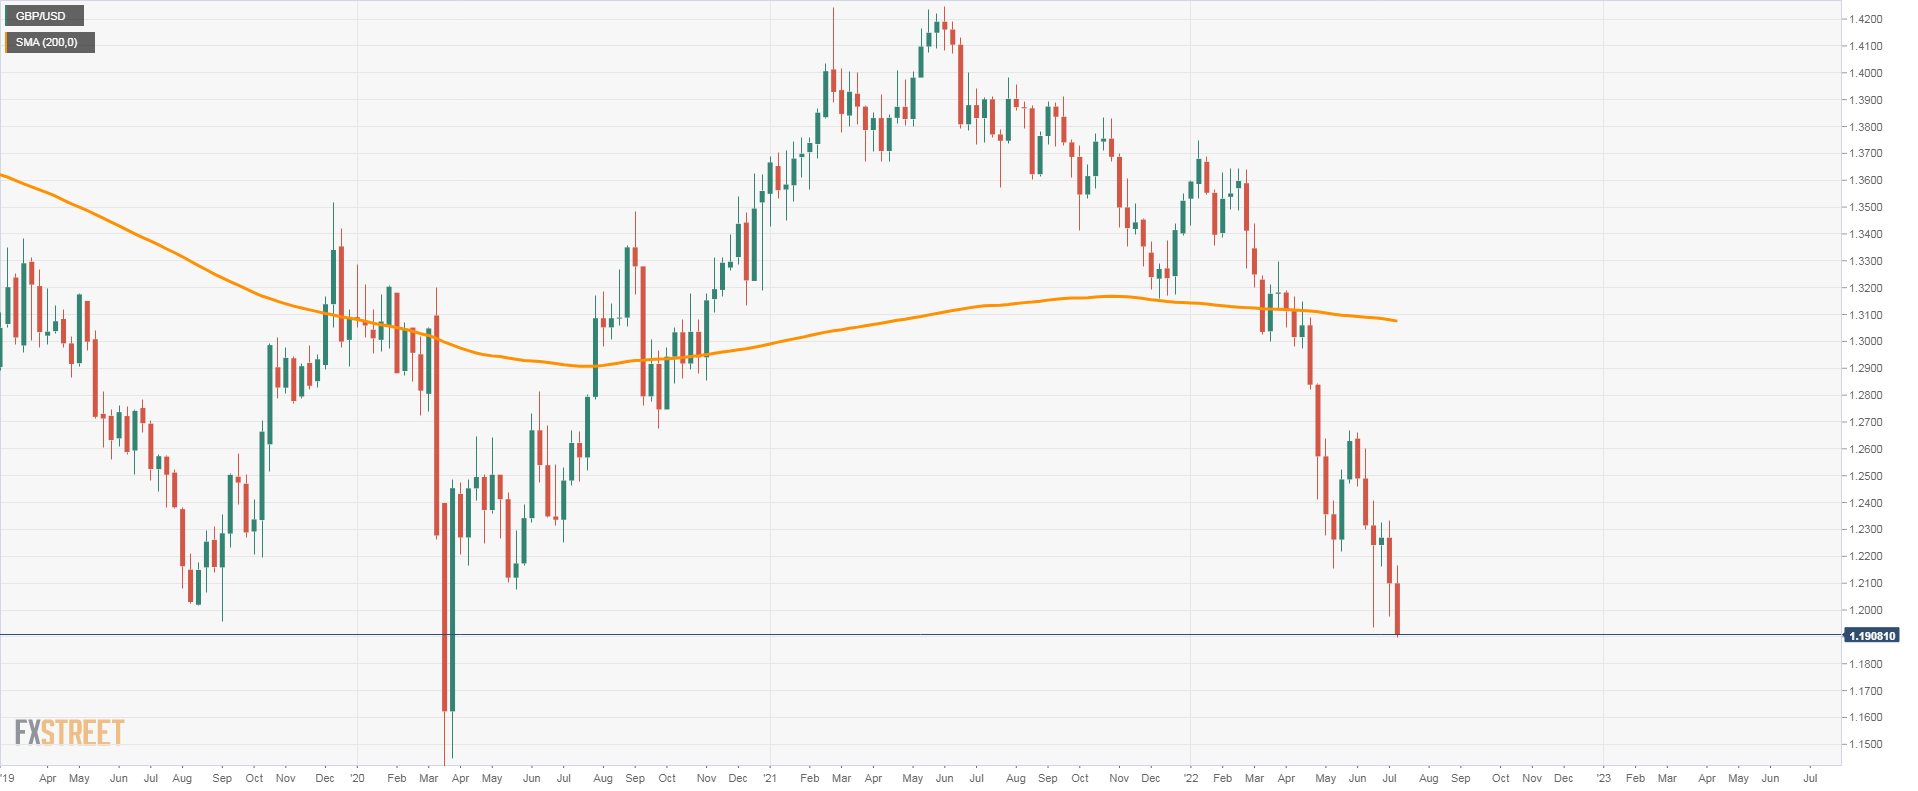
- GBP/USD is headed for the lowest close since March 2020.
- The US dollar maintains significant daily gains as Wall Street falls.
Risk aversion continues to weigh on the GBP/USD. The pair fell further, reaching 1.1897, the lowest level since March 2020. Still under pressure around 1.1900, unable to find support as markets fall.
Fears of a global recession and worsening growth prospects in the UK continue to drive the pound lower, in line with many analysts’ forecasts. At the same time, the demand for the USD increases. DXY is trading at the highest level since 2002 at 106.70, up 1.46% on the day.
Stock prices on Wall Street fall 1.70%. The FTSE 100 has fallen almost 3% and the DAX 2.75%. Commodity prices sink, with gold down 2% and silver down 2.95%. Oil plummets, falling 8.50%.
Adding to the concern, Norway has just warned that gas exports to the UK could be cut off this weekend. A strike threatens production in the Scandinavian country.
The British pound is among the worst performers of the American session. EUR/GBP has erased daily losses and is back around 0.8600 after earlier falling as low as 0.8540.
Economic data beat expectations in the UK and the US. The UK S&P Global Service PMI was revised higher in June from 53.4 to 54.3. In the US, factory orders rose 1.6% in May, beating the 0.5% market consensus. Market participants ignored the figures. The FOMC Minutes will be released on Wednesday and the Non-Farm Payrolls on Friday.
GBP/USD weekly chart
Technical levels
Source: Fx Street
With 6 years of experience, I bring to the table captivating and informative writing in the world news category. My expertise covers a range of industries, including tourism, technology, forex and stocks. From brief social media posts to in-depth articles, I am dedicated to creating compelling content for various platforms.


