
- Inflation in the UK supported the pound sterling, which appreciated and regained some ground against the dollar.
- The prices paid by producers in the US fell, showing signs of relaxation.
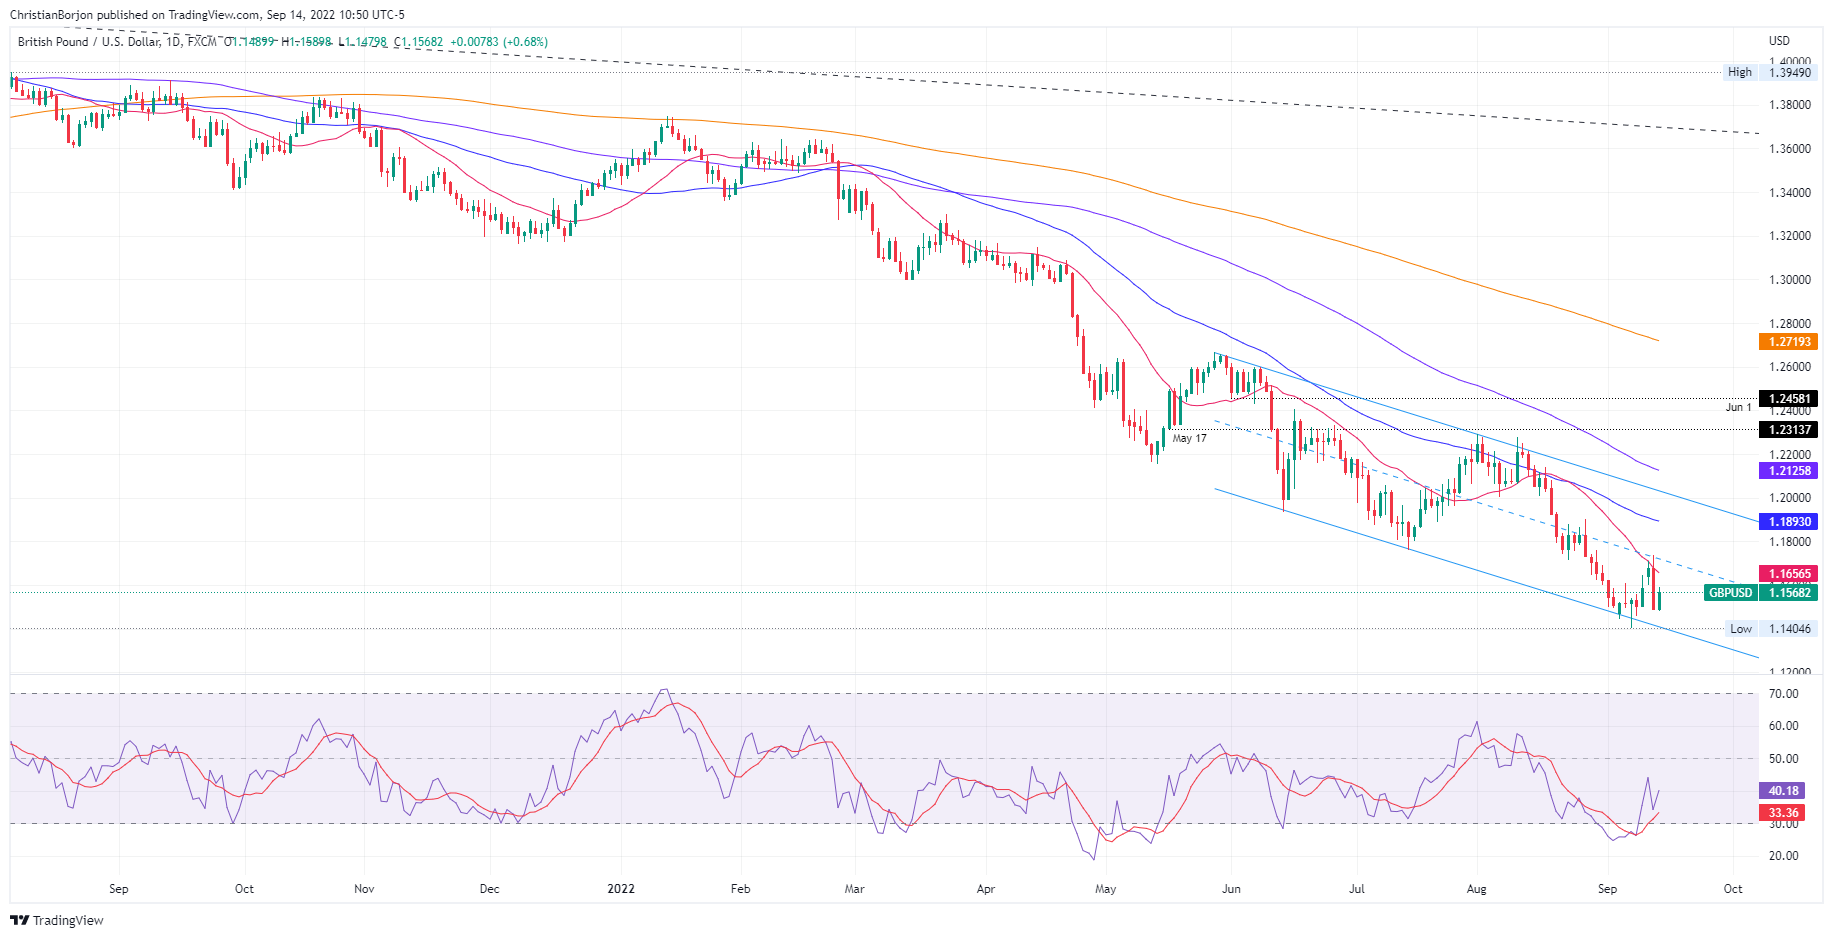
- GBP/USD Price Analysis: Break above 1.1600 to open the door for higher prices; otherwise, it could retest the lows of the year.
The GBP/USD is paring some of Tuesday’s losses after the UK CPI showed signs of slowing, while prices paid by US producers in August rose, especially in the core PPI, in line with the reading of the Tuesday’s CPI.
During the day, GBP/USD reached a daily low of 1.1479. but rose after the UK report, causing GBP/USD to break above the 1.1500 level and hit its daily high around current exchange rates. At the time of this writing, the GBP/USD pair is trading at 1.1565, up 0.65% from its opening price.
The US Department of Labor reported on Wednesday that the producer price index (PPI) for August moderated, falling 0.1% month-on-month, in line with forecasts, while the annual reading dipped one percentage point to 8.7% compared to 9.8% the previous month. As for the core PPI, each month it rose by 0.4%, but annually it beat estimates, standing at around 7.3%.
In the United Kingdom, the Office for National Statistics (ONS) revealed that inflation fell in August after exceeding the 10% threshold, which had not been seen for 40 years. Although this is good news for the Bank of England (BoE), it would not deter the central bank from raising rates. In addition, the appointment of a new Prime Minister in the figure of Liz Truss keeps market agents at bay, waiting for her plan on the energy bill to come into effect.
Analysts at ING wrote in a note that they expect the Bank of England to raise rates by 50 basis points next week, even though the environment is not supportive of sterling. They added: “Slow growth and weakness in equity markets should leave sterling an underperforming stock.”
What to watch out for
An absent UK economic docket would keep traders on the lookout for US dollar dynamics. Jobless claims, New York Fed and Philadelphia Fed business indices, along with important retail sales figures will be released on the US economic calendar.
GBP/USD Price Analysis: Technical Outlook
The GBP/USD daily chart shows the pair recovering from weekly lows below the psychological level of 1.1500. A daily close above the September 12 low at 1.1600 would pave the way for the 1.1700 figure, but a series of US economic data ahead of the FOMC meeting could prevent traders from opening new bets against to the dollar. To the downside, a break below 1.1500 would re-expose the all-time low at 1.1404.
Technical levels
Source: Fx Street
With 6 years of experience, I bring to the table captivating and informative writing in the world news category. My expertise covers a range of industries, including tourism, technology, forex and stocks. From brief social media posts to in-depth articles, I am dedicated to creating compelling content for various platforms.


