
- GBPUSD trims a significant portion of its weekly gains amid resurgence in dollar demand.
- A sustained break below the 1.1400 signal will pave the way for further losses.
- Recovery attempts could be seen as a selling opportunity and be capped.
The pair GBPUSD comes under heavy selling pressure on Wednesday and halts the three-day uptrend to the one-week highs hit the previous day. The intraday drop picks up during the early American session and drags the pair to a fresh daily low, with bears waiting for sustained weakness below 1.1400.
A further rise in US Treasury yields, coupled with a generally weaker tone around equity markets, help the US dollar to recover to a good level from a multi-week low. Sterling, on the other hand, is weighed down by the Bank of England’s gloomy outlook for the British economy. The combination of the above factors attracts new sellers around the GBPUSD pair and supports the prospects for further losses.
The overnight failure from near 1.1600 adds credence to the negative outlook. That said, the technical indicators on the daily chart are yet to confirm a bearish bias and warrant some caution. This makes it prudent to wait for some follow-up selling before confirming that the post-NFP recovery move from levels just below the 1.1100 midway has been exhausted and positioning for a further GBPUSD depreciation move. .
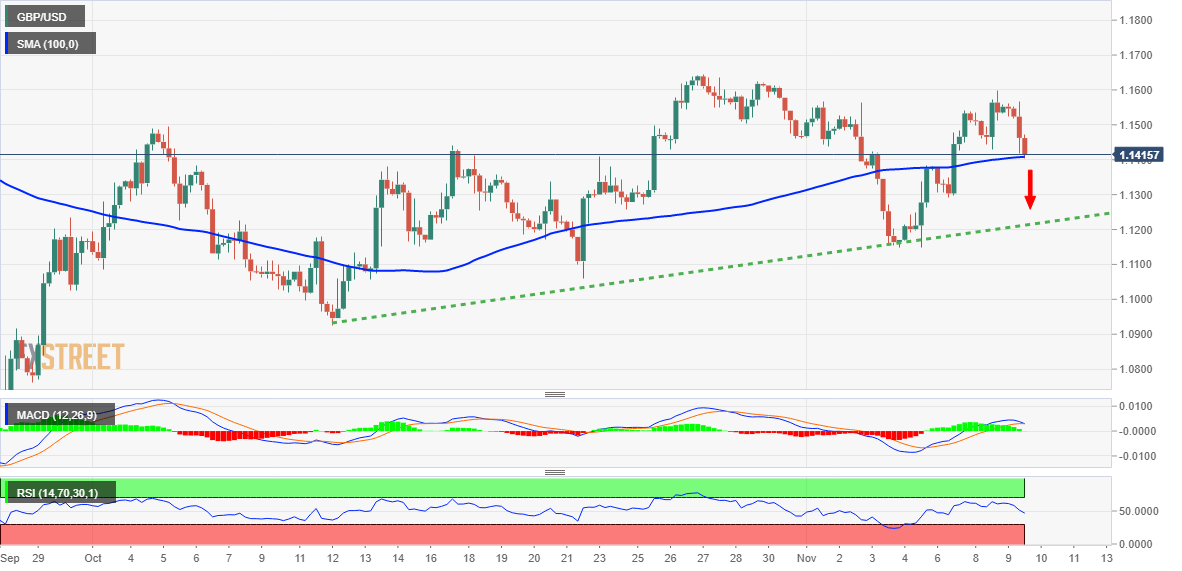
The pair could accelerate to the intermediate support of 1.1355-1.1350 before finally falling to the round figure of 1.1300. The bearish trajectory could extend further and expose 1.1200, below which GBPUSD could look to retest last week’s low around 1.1150.
On the other hand, the 1.1445-1.1450 area seems to act as a strong immediate resistance ahead of the key psychological level 1.1500. Any further recovery could continue to attract fresh offers near the 1.1575-1.1580 area and remain capped. That said, some follow-through buying beyond 1.1600 will negate the negative bias and lift GBPUSD towards October’s monthly high around the 1.1645 area.
GBPUSD 4 hour chart
Key levels to watch
Source: Fx Street
With 6 years of experience, I bring to the table captivating and informative writing in the world news category. My expertise covers a range of industries, including tourism, technology, forex and stocks. From brief social media posts to in-depth articles, I am dedicated to creating compelling content for various platforms.


