
- The price of gold continues to trade above the key support level.
- The 10-year US Treasury bond yield falls after Monday’s rise.
- Sellers could act if XAUUSD breaks below $1,840.
The price of gold posted daily losses on Monday, but managed to erase a portion of its losses on Tuesday. However, the recent price action does not point to a buildup of bullish momentum. However, the important technical support lining up at $1,840 remains intact for now, keeping sellers on the sidelines.
US bond yields fall
Following the previous week’s rally, the benchmark 10-year US Treasury yield rose on Monday, breaking above the key 3% level. In the absence of shocking macroeconomic data releases, the positive US employment report allowed yields to rise further. According to CME Group’s FedWatch tool, the probability that the Fed will raise its policy rate by a total of 125 basis points in the next two meetings has risen to 15% from 4% last week. With safe-haven flows dominating financial markets on Tuesday, yields dipped and helped XAU/USD recover.
Gold price ignores US data
Data released by the US Census Bureau on Tuesday revealed that the US goods and services deficit shrank by $20.6 billion to $87.1 billion in April. During that period, exports increased by $8.5 billion to $252.6 billion, while imports fell by $12.1 billion to $339.7 billion. These figures hardly caused a reaction from the market and gold continued to fluctuate in its daily range.
Earlier, the monthly report released by the People’s Bank of China (PBOC) showed that China’s gold reserves were stable at 62.64 million fine troy ounces at the end of May. However, the value of China’s gold reserves decreased to $115.18 billion at the end of May, from $119.73 billion at the end of April. Last week, Bloomberg reported that India’s gold reserves rose 9.4% in annual terms to 760.4 in the year ended March.

Meanwhile, investors brace for this week’s key events and data. The European Central Bank will announce its policy decision on Thursday and the US Bureau of Labor Statistics will release Consumer Price Index (CPI) data on Friday. Although the US Federal Reserve uses the personal consumption expenditures (PCE) price index as its preferred gauge of inflation, the CPI reading is likely to provoke a significant market reaction. Analysts expect the CPI to decline to 8.2% in May from 8.3% in April. Stronger-than-expected data should boost yields and weigh on XAU/USD and vice versa.
Gold Price Technical Outlook
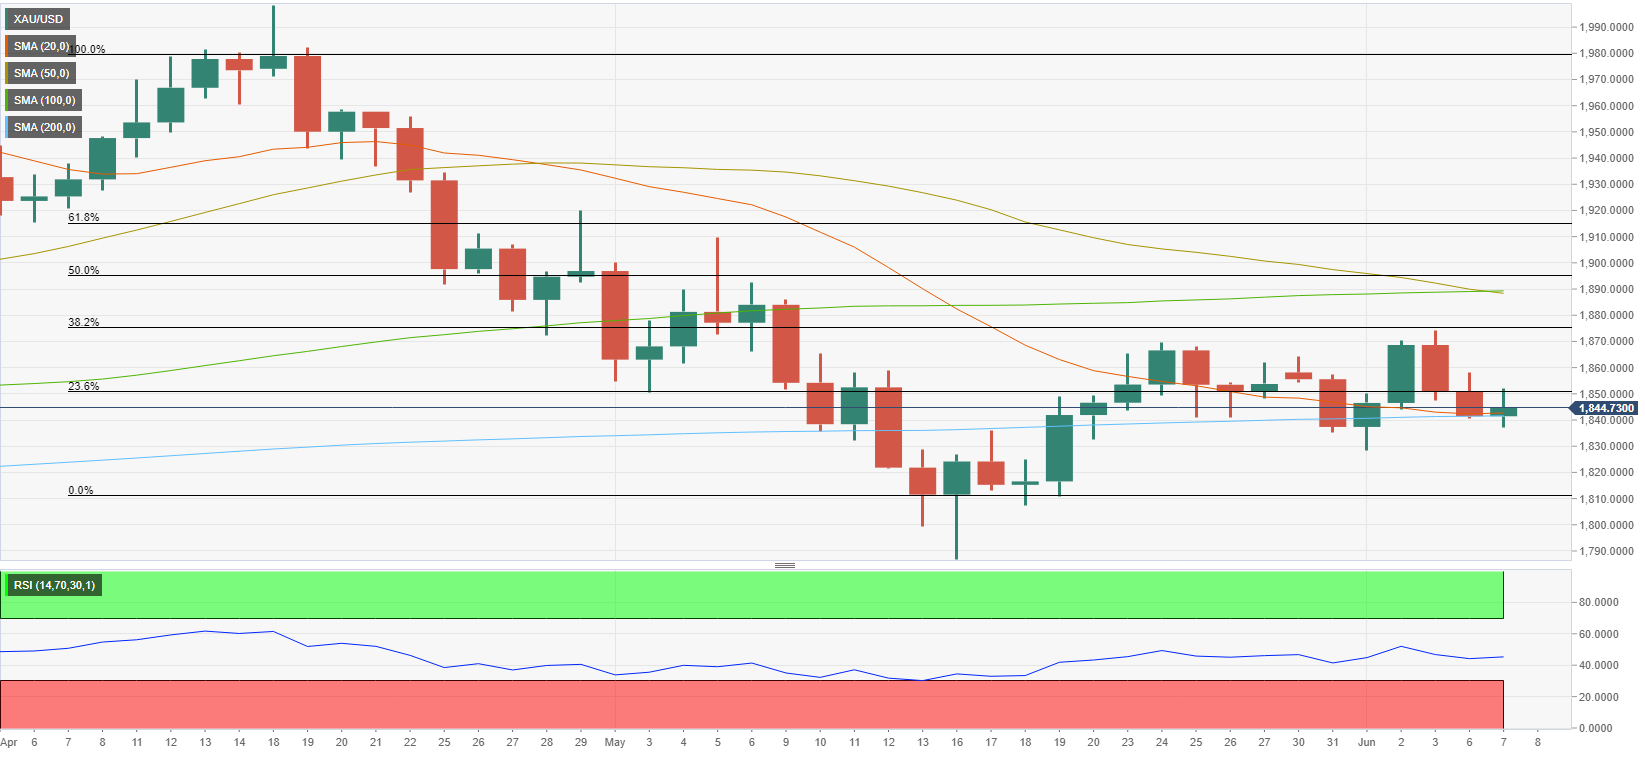
The price of gold is still trading above the 200-day SMA, which is currently at $1,840. When gold made a daily close below that level on May 31, it managed to recover it the next day. Therefore, sellers could wait for confirmation that $1,840 has become resistance before acting. In that scenario, $1,830 (static level) lines up as interim support ahead of $1,810 (endpoint of the last downtrend) and $1,800 (psychological level).
On the other hand, $1,850 (23.6% Fibonacci retracement) is an initial resistance. A daily close above that level could be considered bullish and open the door for a prolonged bounce towards $1,874 (38.2% Fibonacci retracement) and $1,890 (50-day SMA, 100-day SMA).
Source: Fx Street
With 6 years of experience, I bring to the table captivating and informative writing in the world news category. My expertise covers a range of industries, including tourism, technology, forex and stocks. From brief social media posts to in-depth articles, I am dedicated to creating compelling content for various platforms.


