
- The price of gold is on a downtrend and the FOMC Minutes have fueled the sell-off.
- The weekly chart for gold shows support near the 78.6% fibonacci retracement level at $1,807.
the price of gold it is under pressure around 0.3% on the day and remains in the hands of the bears after the release of the first 2023 Federal Open Market Committee Minutes.
The minutes were released so investors have been seeking more information on the near-term path of policy and any comment on the possibility of the Federal Reserve returning to 50 basis point hikes. The minutes showed that some participants had come out in favor of raising rates by 50 basis points, which has put a bid on the US dollar, but left the US Treasury yield relatively stable. This has left gold price a bit pressured around the day’s low near $1,825.54 after the yellow metal fell from a high of $41,846.05 earlier in the day.
For their part, Rabobank analysts, taking into account the strength of the latest economic data, explained that the current comments from Fed officials may be more forthcoming in terms of providing clues for the upcoming FOMC meeting on March 23. , than the minutes of February 1.
In this regard, St. Louis Fed President James Bullard reinforced hawkish sentiment ahead of Wednesday’s Fed minutes. Bullard said the Fed has to get inflation on a sustainable path toward its 2% target this year or risk a repeat of the 1970s, when interest rates had to be raised repeatedly. ‘
Looking ahead to the rest of the week, regarding the next data releases, the market consensus points to the strength of the consumption and personal spending data, a sign of strong domestic demand. ”The Fed’s favorite inflation measure, the PCE deflator, will also be published this week,” the Rabobank analysts explain.
The market expects the main data for January to remain at 5.0% year-on-year, in line with the previous month. This would reinforce the concern that the downward trend in inflationary indicators has stalled. Data in line with market expectations would reinforce the view that the Fed will have to do more to bring inflation back to its target level. Currently, implicit market rates point to a top for Fed funds near 5.33%”.
Gold Technical Analysis
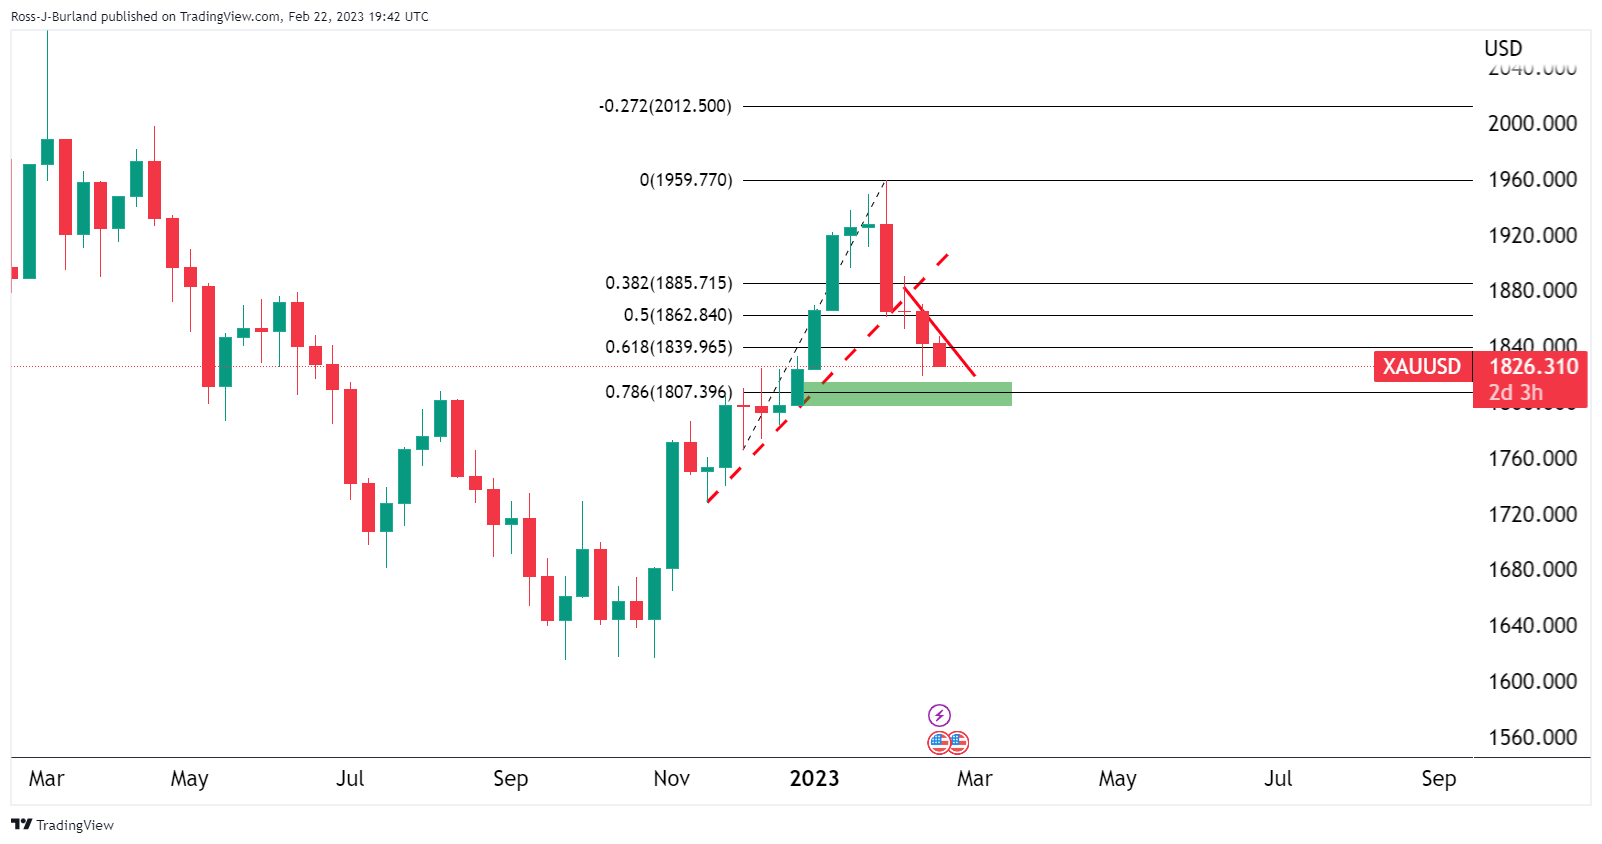
The weekly chart for gold shows support near the 78.6% fibonacci retracement level at $1,807. The market is on the back of the previous uptrend and on the front of the downtrend as illustrated above, thus offering a bearish bias to the said and shown support structure.
Source: Fx Street
I am Joshua Winder, a senior-level journalist and editor at World Stock Market. I specialize in covering news related to the stock market and economic trends. With more than 8 years of experience in this field, I have become an expert in financial reporting.


