
- Gold consolidates just below new all-time highs on Thursday.
- Falling global interest rates, escalating geopolitical conflicts and increasing Fed easing bets are the main drivers.
- XAU/USD is overbought but recovering and in an uptrend on all time frames.
Gold (XAU/USD) is trading higher at $2,660 per troy ounce on Thursday amid falling global interest rates, an escalation of conflict in the Middle East and a weaker US Dollar (USD) due to increased likelihood that the US Federal Reserve (Fed) will continue its aggressive monetary easing strategy.
Gold is trading near historic highs
Gold is trading just below its all-time high of $2,670 hit on Wednesday. Decisions by the People’s Bank of China (PBoC), Sweden’s Riksbank and the Czech Central Bank to cut interest rates in recent days are advantageous for gold as they reduce the opportunity cost of holding the non-interest-paying asset, making it more attractive for investors.
An additional factor on the upside is the escalation of the conflict between Israel and Hezbollah. On Wednesday, amid ongoing missile exchanges between the two foes, Israel Defense Forces chief Herzi Halevi told his troops in northern Israel that they should prepare for a ground offensive in Lebanon. If such an invasion goes ahead, it will further increase risk aversion and boost safe-haven flows into the yellow metal.
Gold rises on rising expectations of a 50bp cut from the Federal Reserve
Although US new home sales data for August and robust mortgage applications on Wednesday did not add any evidence that the US economy is heading for a hard landing, markets continue to price in another 50 basis points (bps) (0.50%) interest rate cut from the Federal Reserve (Fed) at its November meeting. Labor market data may be more important in this regard, and jobless claims data due on Thursday could impact both the USD and Gold.
Market-based odds of a 50bp cut, according to the CME FedWatch tool, remain above 60%, which is higher than the alternative: a modest 25bp reduction. This keeps pressure on the US dollar and adds an additional tailwind to Gold, which is primarily priced and traded in USD.
Tuesday’s data confirmed investors’ worst fears after the Conference Board’s Consumer Confidence Index fell to 98.7 in September from an upwardly revised 105.6 in August. The result was well below consensus estimates. Labor market concerns expressed by respondents were a major factor.
Gold may also be holding on to its highs after Fed Governor Adriana Kugler (voting member) delivered a relatively dovish speech on Wednesday. Kugler’s comments earned a score of 3.2 on FXStreet’s FedTracker, which measures the tone of Fed officials’ speeches on a dovish to hawkish scale from 0 to 10, using a custom AI model.
Fed Chairman Jerome Powell is scheduled to speak on Thursday and could impact market expectations regarding Fed policy with implications for the price of gold.
Technical Analysis: Gold consolidates just below all-time highs
Gold is consolidating just below its all-time high of $2,670 on Thursday. Overall, it is in a short-, medium- and long-term uptrend. Since it is a fundamental principle of technical analysis that “the trend is your friend,” the odds favor even more upside for the yellow metal.
XAU/USD Daily Chart
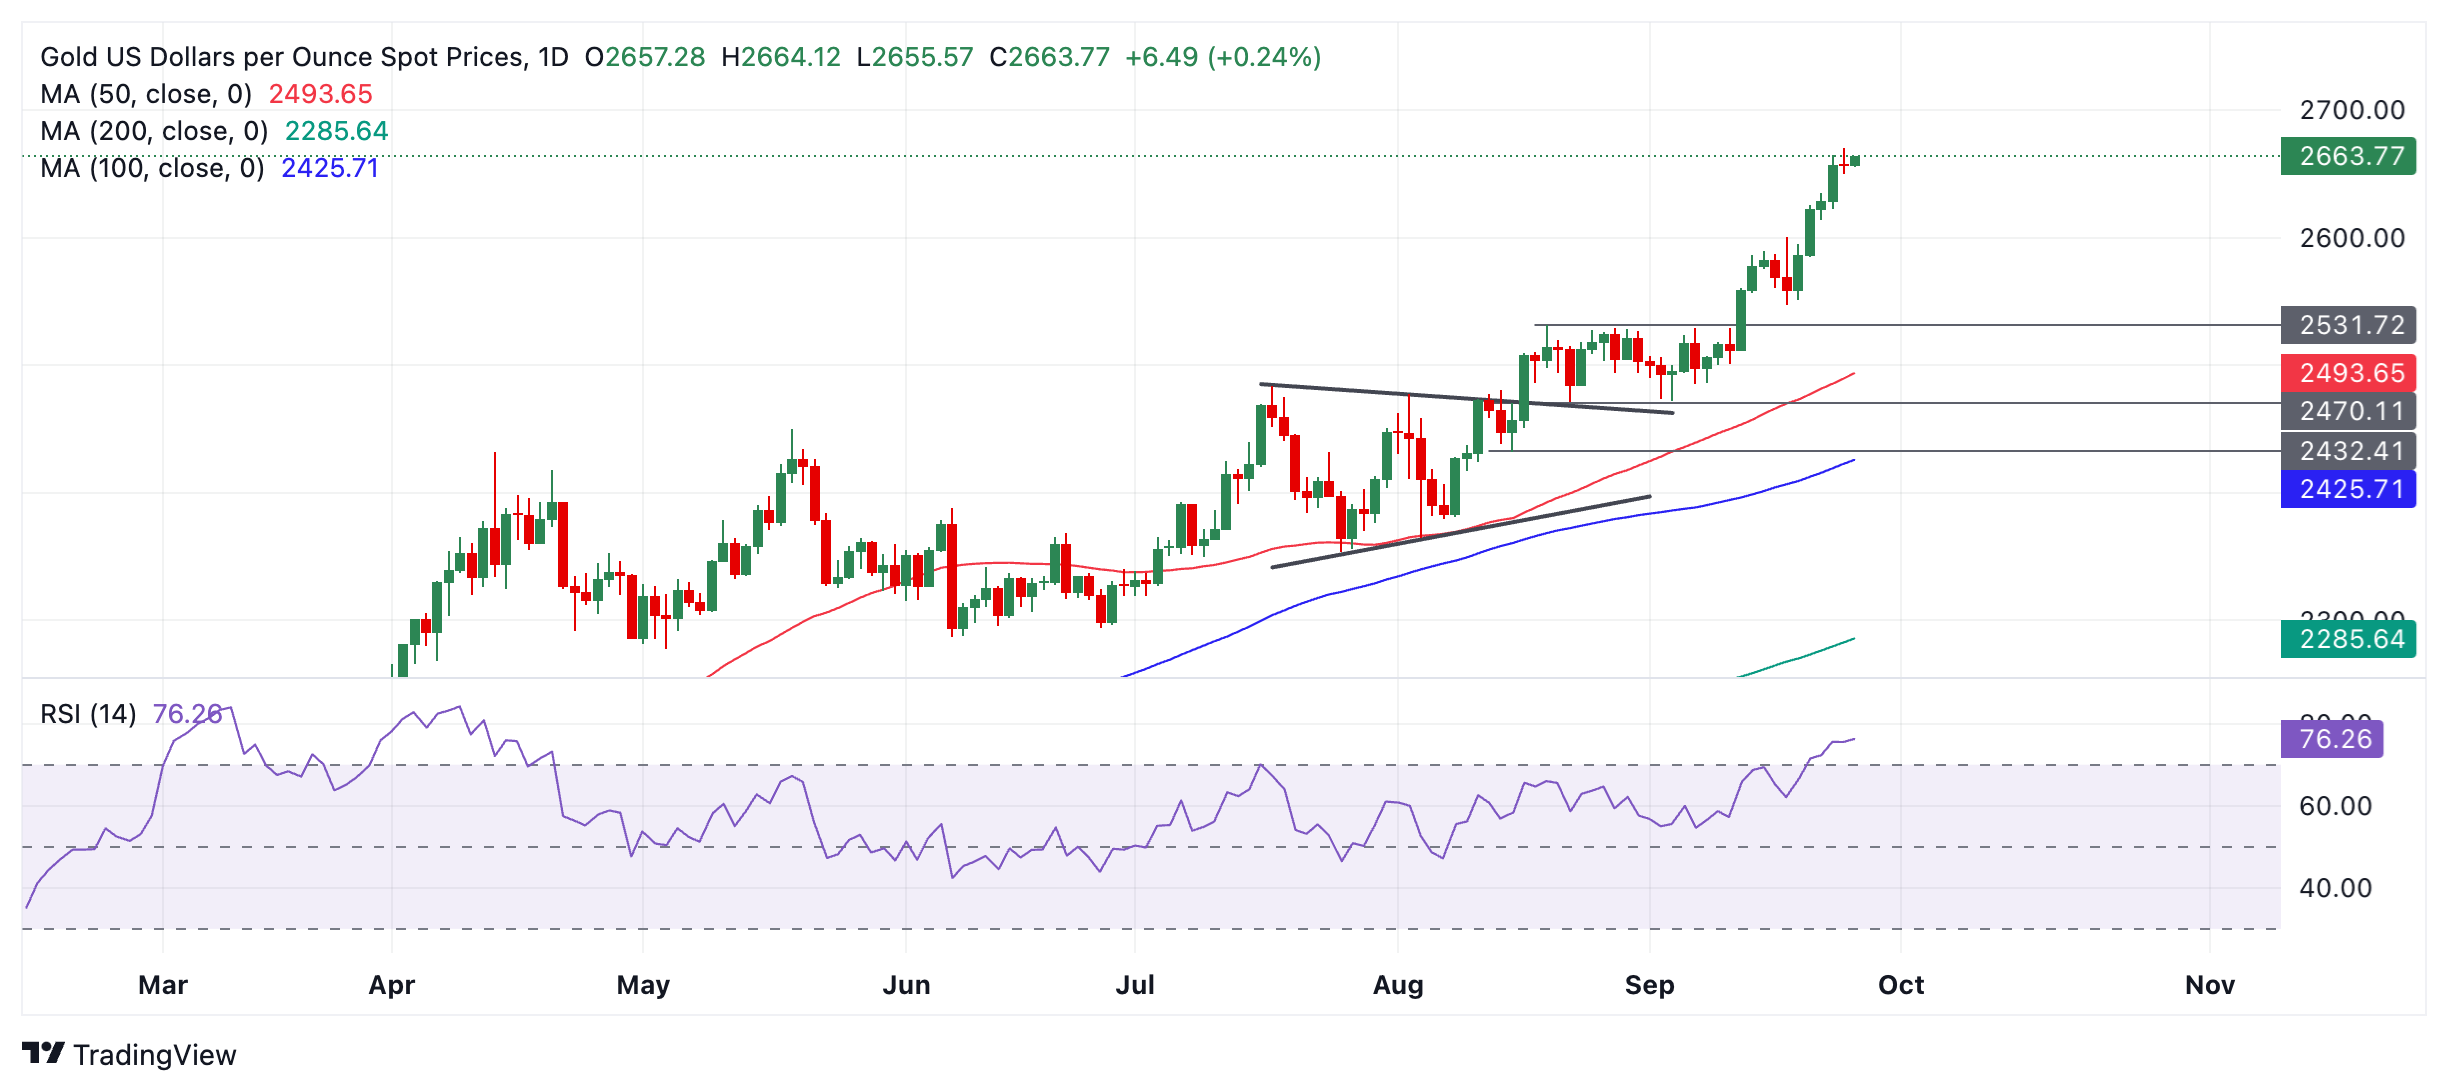
However, Gold is now also overbought, according to the Relative Strength Index (RSI) momentum indicator, and this increases the chances of a pullback. It also advises traders not to add to their long positions. If Gold breaks out of overbought territory, it will be a signal to close long positions and sell shorts, as it would suggest that a correction is in the process of developing.
That said, the RSI can remain overbought for fairly long periods in a strongly trending market, and if Gold breaks above its all-time high, it will confirm the establishment of a higher high and the extension of the uptrend. The next upside targets are the round numbers of $2,700 and then $2,750.
If a correction develops, firm support lies at $2,600 (September 18 high), $2,550 and $2,544 (.382 Fib retracement of the September rally).
Economic indicator
Weekly unemployment benefit applications
Weekly unemployment benefit applications are published by the US Department of Labor and is a measure of the number of people who have filed for their first-time claim for unemployment insurance. In other words, it provides a measure of the strength in the labor market. A higher-than-expected number indicates weakness in the labor market, which influences the strength and direction of U.S. economic activity. Thus, a lower-than-expected reading is bullish for the dollar.
Next post:
Thu Sep 26, 2024 12:30 PM
Frequency:
Weekly
Dear:
225K
Previous:
219K
Fountain:
US Department of Labor
Every Thursday, the US Department of Labor publishes the number of initial claims for unemployment benefits for the previous week in the US. Since this reading could be very volatile, investors may pay more attention to the four-week average. A downward trend is considered a sign of an improving labor market and could have a positive impact on the performance of the USD against its rivals and vice versa.
Source: Fx Street
I am Joshua Winder, a senior-level journalist and editor at World Stock Market. I specialize in covering news related to the stock market and economic trends. With more than 8 years of experience in this field, I have become an expert in financial reporting.


