
- Gold falls 0.33% as markets anticipate a Fed rate cut.
- Markets have almost fully priced in a 25 basis point rate cut; The focus shifts to the Fed’s dot chart for information on the rate path in 2025.
- Investors remain attentive to US data, including GDP data and core PCE.
The price of gold extended its bearish trend for the second consecutive day as traders prepare for the Federal Reserve’s (Fed) monetary policy decision. Although market participants widely expect a rate cut, they are watching for signs on the path of interest rates in 2025. At the time of writing, XAU/USD is trading at $2,636, down 0.33%.
Traders have priced in a 95.4% probability of a 25 basis point (bp) rate cut by the Fed, but are mainly focused on the Summary of Economic Projections (SEP), known as the dot chart, that Fed officials use to express their opinions on monetary policy.
At the September meeting, the dot plot hinted that policymakers project the federal funds rate to end 2025 near 3.4%, down from 4.1% in June.
However, strong US economic data, a stalled disinflationary process and the next administration’s expansionary fiscal policies could prevent Fed Chair Jerome Powell and his team from aggressively easing policy.
Some analysts said that if the dot plot adjusts to two rate cuts instead of four, it would be considered hawkish and supportive of the US dollar.
The US economic agenda features strong housing data with optimistic building permits for November, while housing starts fell for the fourth consecutive month.
This week, investors will also focus on Thursday’s US GDP data and the underlying personal consumption expenditure (PCE) price index, the Fed’s favorite inflation gauge, which could impact demand. of ingots.
Daily Market Summary: Gold Price Declines as US Yields Rise
- Gold prices fell as US real yields recovered, rising one basis point to 2.085%, a headwind for the precious metal.
- The 10-year US Treasury yield remains firm at 4.395%, unchanged.
- The US Dollar Index, which tracks the performance of the US currency against six other currencies, rose 0.20% to 107.15.
- Building permits in November increased 6.1% month-on-month from 1.419 million to 1.505 million.
- Housing starts for the same period fell -1.8% month-on-month from 1.312 million to 1.289 million.
- Recently released US retail sales data and flash PMIs suggest the economy remains strong amid interest rates set above 4%. Although inflation fell, core prices stagnated at 3% and headline inflation posted higher readings for three consecutive months, suggesting inflation risks are skewed to the upside.
- The CME’s FedWatch tool suggests traders have priced in a 95% probability of a quarter-point rate cut on Wednesday.
- By 2025, investors are betting the Fed will cut rates by 100 basis points.
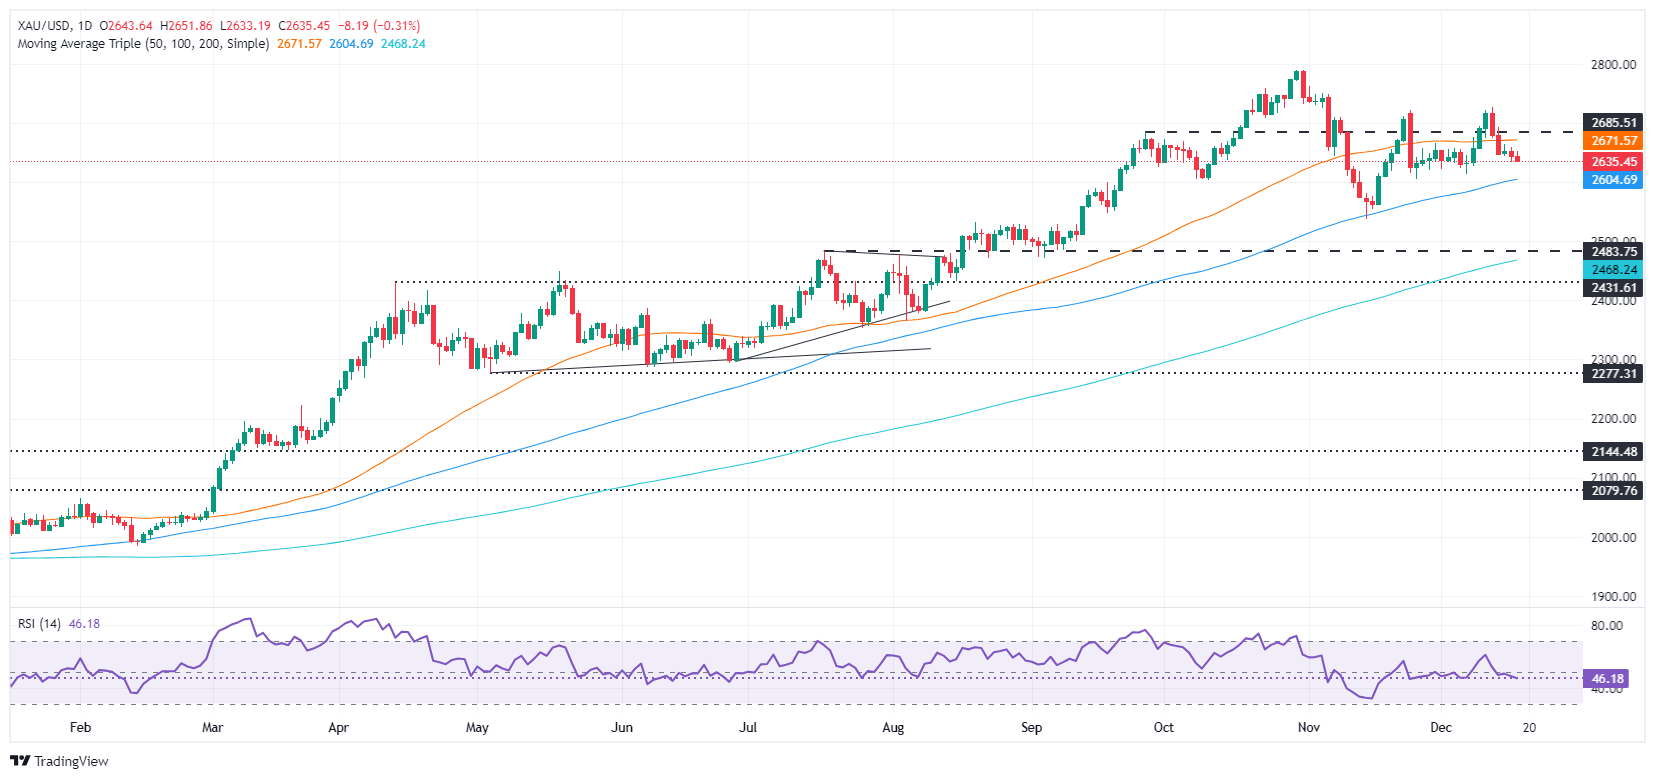
Technical Outlook: Gold Price Pulls Back, Sellers Target 100-Day SMA
The price of gold remains biased upwards, although it has remained trading sideways for the last three days, with no definitive direction. The gold metal is trading within the $2,602-$2,670 area, capped by the 100-day and 50-day simple moving averages (SMA), respectively.
For a bullish resumption, XAU/USD must surpass $2,650, followed by the 50-day SMA at $2,670. If it breaks, the next stop would be $2,700. On the contrary, if XAU/USD falls below the 100-day SMA, the next support would be $2,600. If the price falls, the next support would be the November 14 low of $2,536, before challenging the August 20 peak of $2,531.
Gold FAQs
Gold has played a fundamental role in human history, as it has been widely used as a store of value and medium of exchange. Today, apart from its brilliance and use for jewelry, the precious metal is considered a safe-haven asset, meaning it is considered a good investment in turbulent times. Gold is also considered a hedge against inflation and currency depreciation, since it does not depend on any specific issuer or government.
Central banks are the largest holders of Gold. In their aim to support their currencies in turbulent times, central banks tend to diversify their reserves and purchase Gold to improve the perception of strength of the economy and currency. High Gold reserves can be a source of confidence for the solvency of a country. Central banks added 1,136 tons of gold worth about $70 billion to their reserves in 2022, according to data from the World Gold Council. This is the largest annual purchase since records exist. Central banks in emerging economies such as China, India and Türkiye are rapidly increasing their gold reserves.
Gold has an inverse correlation with the US Dollar and US Treasuries, which are the main reserve and safe haven assets. When the Dollar depreciates, the price of Gold tends to rise, allowing investors and central banks to diversify their assets in turbulent times. Gold is also inversely correlated with risk assets. A rally in the stock market tends to weaken the price of Gold, while sell-offs in riskier markets tend to favor the precious metal.
The price of Gold can move due to a wide range of factors. Geopolitical instability or fear of a deep recession can cause the price of Gold to rise rapidly due to its status as a safe haven asset. As a non-yielding asset, the price of Gold tends to rise when interest rates fall, while rising money prices tend to weigh down the yellow metal. Still, most of the moves depend on how the US Dollar (USD) performs, as the asset is traded in dollars (XAU/USD). A strong Dollar tends to keep the price of Gold in check, while a weaker Dollar is likely to push up Gold prices.
Source: Fx Street
I am Joshua Winder, a senior-level journalist and editor at World Stock Market. I specialize in covering news related to the stock market and economic trends. With more than 8 years of experience in this field, I have become an expert in financial reporting.


