- Gold price rally above the $1,950 level as markets brace for inflation data.
- Worries about rate hikes and the banking sector weigh on yields as China tries to lure XAU/USD bulls.
- Central bank speeches and inflation data will guide gold price amid end-of-quarter positioning.
The price of Gold (XAU/USD) moves for the second day in a row around $1,965, as the US dollar, as well as Treasury yields, struggle to defend the previous day’s gains amid mixed sentiment during the European session on Thursday. Thus, the yellow metal remains stable amid a climate of caution awaiting inflation data from Europe and the United States.
In terms of sentiment, the DXY US Dollar Index pulls back from its intraday high and posts slight losses near 102.60, while S&P 500 futures hit new one-week highs. In addition, the 10-year and 2-year US Treasury yields lose upward momentum at around 3.57% and 4.09%, respectively.
Chinese Premier Li Qiang’s hopes that the economic situation in March is even better than in January and Februarycoupled with signals from Fed Chairman Jerome Powell about a turn in monetary policy following a further rate hike, appear to have underpinned the latest rise in gold prices.
It should be noted, however, that most central bankers defend their earlier bias on inflation and therefore challenge gold buyers. On the other hand, the Managing Director of the International Monetary Fund (IMF), Kristalina Georgieva, has declared on Thursday: “We urgently need faster and more effective mechanisms to provide debt support to vulnerable countries“, and his comments renew fears around the banking sector, which had previously subsided.
Above all, the market preparations for the European and US inflation figures seem to allow the gold price to pare the weekly losses. That being said, the underlying US Q4 Personal Consumption Expenditure (PCE) and final Q4 Gross Domestic Product (GDP) figures may entertain XAU/USD intraday traders.
Gold Price Technical Analysis
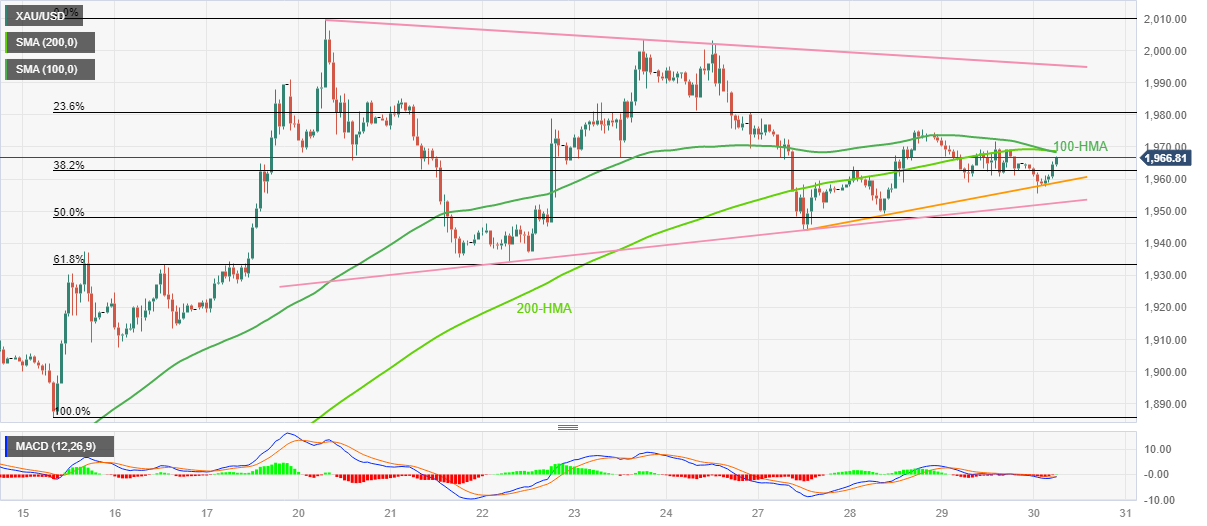
Gold Price Bounces From Weekly Support Line While Holding inside an eight day old symmetrical triangle. In doing so, the XAU/USD pays little attention to the sluggish MACD.
That being said, the price of gold is currently rallying towards a convergence of the 100 and 200 hourly moving averages around the $1,970the break of which could push the XAU/USD towards the barrier of the $1,985.
However, the upper line of the triangle, near the $1,996quickly followed by the psychological level of the $2,000could challenge gold buyers.
Meanwhile, the immediate support line precedes the bottom line of the aforementioned triangle to support the near-term XAU/USD slide near $1,958 and $1,950.
Further down, a quick drop to the 61.8% Fibonacci retracement of the March 15-20 rally is not ruled out, near $1,933.
Overall, the gold price remains sideways despite the latest rally.
gold price 1 hour chart
Trend: Limited recovery expected
additional important levels
XAU/USD
| Panorama | |
|---|---|
| Last Price Today | 1968.45 |
| Today’s Daily Change | 3.65 |
| Today’s Daily Change % | 0.19 |
| Today’s Daily Open | 1964.8 |
| Trends | |
|---|---|
| 20 Daily SMA | 1913.36 |
| SMA of 50 Daily | 1891.3 |
| SMA of 100 Daily | 1848.53 |
| SMA of 200 Daily | 1782.41 |
| levels | |
|---|---|
| Previous Daily High | 1974.5 |
| Minimum Previous Daily | 1958.89 |
| Previous Weekly High | 2009.88 |
| Previous Weekly Minimum | 1934.34 |
| Maximum Prior Monthly | 1959.8 |
| Minimum Prior Monthly | 1804.76 |
| Daily Fibonacci 38.2% | 1964.85 |
| Daily Fibonacci 61.8% | 1968.54 |
| Daily Pivot Point S1 | 1957.63 |
| Daily Pivot Point S2 | 1950.45 |
| Daily Pivot Point S3 | 1942.02 |
| Daily Pivot Point R1 | 1973.24 |
| Daily Pivot Point R2 | 1981.67 |
| Daily Pivot Point R3 | 1988.85 |
Source: Fx Street
I am Joshua Winder, a senior-level journalist and editor at World Stock Market. I specialize in covering news related to the stock market and economic trends. With more than 8 years of experience in this field, I have become an expert in financial reporting.


