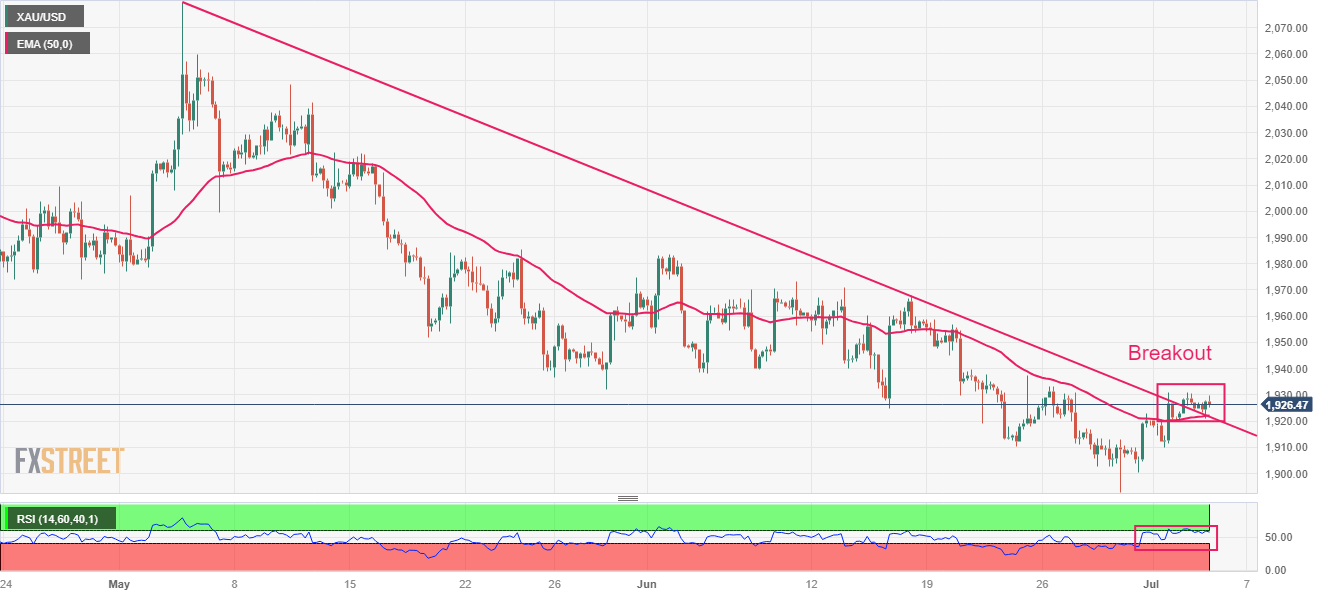
- Gold price is aiming to recapture the crucial resistance at $1,930.00 amid high DXY volatility.
- The upcoming quarterly earnings season is expected to keep US stocks under pressure and some selective action in stocks to be seen.
- Gold price has tried to break the downtrend line drawn from $2,079.76.
The price of Gold (XAU/USD) tries to recover the immediate resistance of $1,930.00 in the European session. The precious metal is picking up steam as investors cling to the Federal Reserve’s (Fed) projection of a single interest rate hike by the end of the year.
S&P 500 futures have posted significant losses in the London session as investors remain cautious ahead of the US markets open after the Independence Day holiday. In addition, the upcoming quarterly earnings season is expected to keep stocks under pressure and watch for some selective stock action.
The Dollar Index (DXY) shows volatility spikes around 103.00 ahead of the Federal Open Market Committee (FOMC) Minutes. Investors are looking for clues about the direction of interest rates. However, Fed Chairman Jerome Powell has begun preparing investors for two more interest rate hikes this year. Therefore, the relative uncertainty of the FOMC minutes may remain shallow.
The volatility in the price of gold would come after the publication of employment data for June. According to estimates, the US jobs report to be released by Automatic Data Processing (ADP) is expected to show a decline in job addition to 180,000 from the previous addition of 278,000.
Investors will also be watching the ISM services PMI data on Thursday. This week, the manufacturing PMI continued its contraction streak for eight months in a row.
Gold technical analysis
Gold price has tried to break the downtrend line drawn from the May high of $2,079.76 on a four-hour scale. If the break is confirmed, the bullish reversal would be activated. The 50 period EMA at $1,922.30 provides support for gold bulls.
The Relative Strength Index (RSI) (14) is looking to move within the 60.00-80.00 bullish range. If this were to occur, the bullish momentum would be activated.
4 hour chart

XAU/USD
| Overview | |
|---|---|
| Last price today | 1928.11 |
| Today Change Daily | 3.29 |
| today’s daily variation | 0.17 |
| today’s daily opening | 1924.82 |
| Trends | |
|---|---|
| daily SMA20 | 1934.98 |
| daily SMA50 | 1966.3 |
| daily SMA100 | [194578 |
| Daily SMA200 | 1862.33 |
| levels | |
|---|---|
| previous daily high | 1930.76 |
| previous daily low | 1919.94 |
| Previous Weekly High | 1933.39 |
| previous weekly low | 1893.01 |
| Previous Monthly High | 1983.5 |
| Previous monthly minimum | 1893.01 |
| Fibonacci daily 38.2 | 1926.63 |
| Fibonacci 61.8% daily | 1924.07 |
| Daily Pivot Point S1 | 1919.59 |
| Daily Pivot Point S2 | 1914.35 |
| Daily Pivot Point S3 | 1908.77 |
| Daily Pivot Point R1 | 1930.41 |
| Daily Pivot Point R2 | 1935.99 |
| Daily Pivot Point R3 | 1941.23 |
Source: Fx Street
I am Joshua Winder, a senior-level journalist and editor at World Stock Market. I specialize in covering news related to the stock market and economic trends. With more than 8 years of experience in this field, I have become an expert in financial reporting.


