
- Gold is under pressure as the US dollar continues to make highs.
- The US CPI leaves the door open for an aggressive tightening by the Fed.
the price of gold has been under pressure this Tuesday and has fallen more than 1.3% on the day. At the time of writing, the yellow metal is testing the $1,700 level and has reached a low of $1,697.11 so far for the day. Consumer prices far exceeded expectations according to the Labor Department report, and core inflation rose amid rising rent and healthcare costs.
This sent both the dollar and bond yields higher as expectations of an interest rate hike by the Federal Reserve were excessive. Inflation in the United States stood at an annualized rate of 8.3% in August, above expectations of an 8.0% rise. Traders are expecting 75 basis points when their monetary policy committee meets next week, downplaying market hopes for a smaller hike. However, there is a one in five chance that the Fed will raise rates by a full percentage point, up from zero a day before the CPI report, according to FEDWATCH.
The dollar and bond yields rose after the data release on expectations of higher interest rates, which is negative for gold as it offers no yield. The DXY index, which measures the US dollar against a basket of currencies, hit a high of 109,853, while yields on 10-year US Treasuries rose to 3,460%, up more than 1.8% on the day.
Although prices are weak, precious metals price action is still not consistent with its historical performance as rising cycles enter a restrictive rate regime,” TD Securities analysts explained. We expect continued outflows from funds from money managers and ETF holdings will weigh on prices, which will ultimately increase pressure on a small number of family offices and proprietary trading shops to capitulate on their complacent duration in gold.’ ‘.
Gold Technical Analysis
The bulls have been stripped of their place and the focus is back on the downside, while below the neckline of the daily M formation, as it says on the chart:
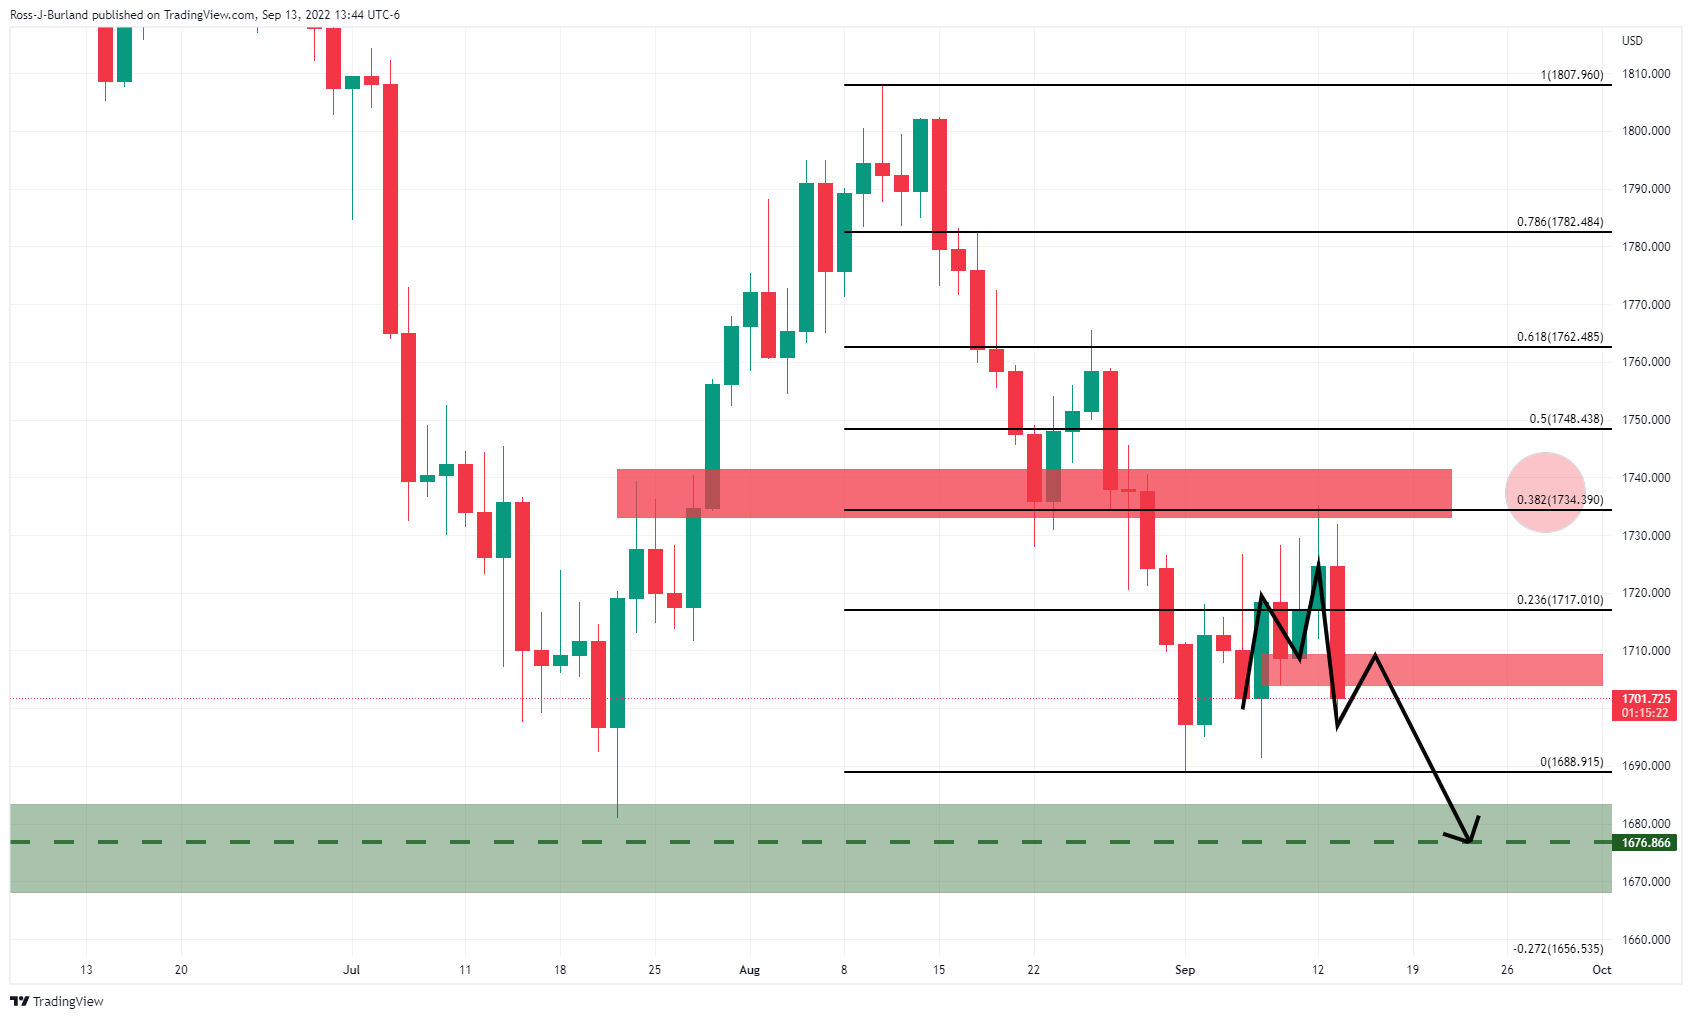
Zooming in, we can see that the bearish target has been a key level for quite some time:
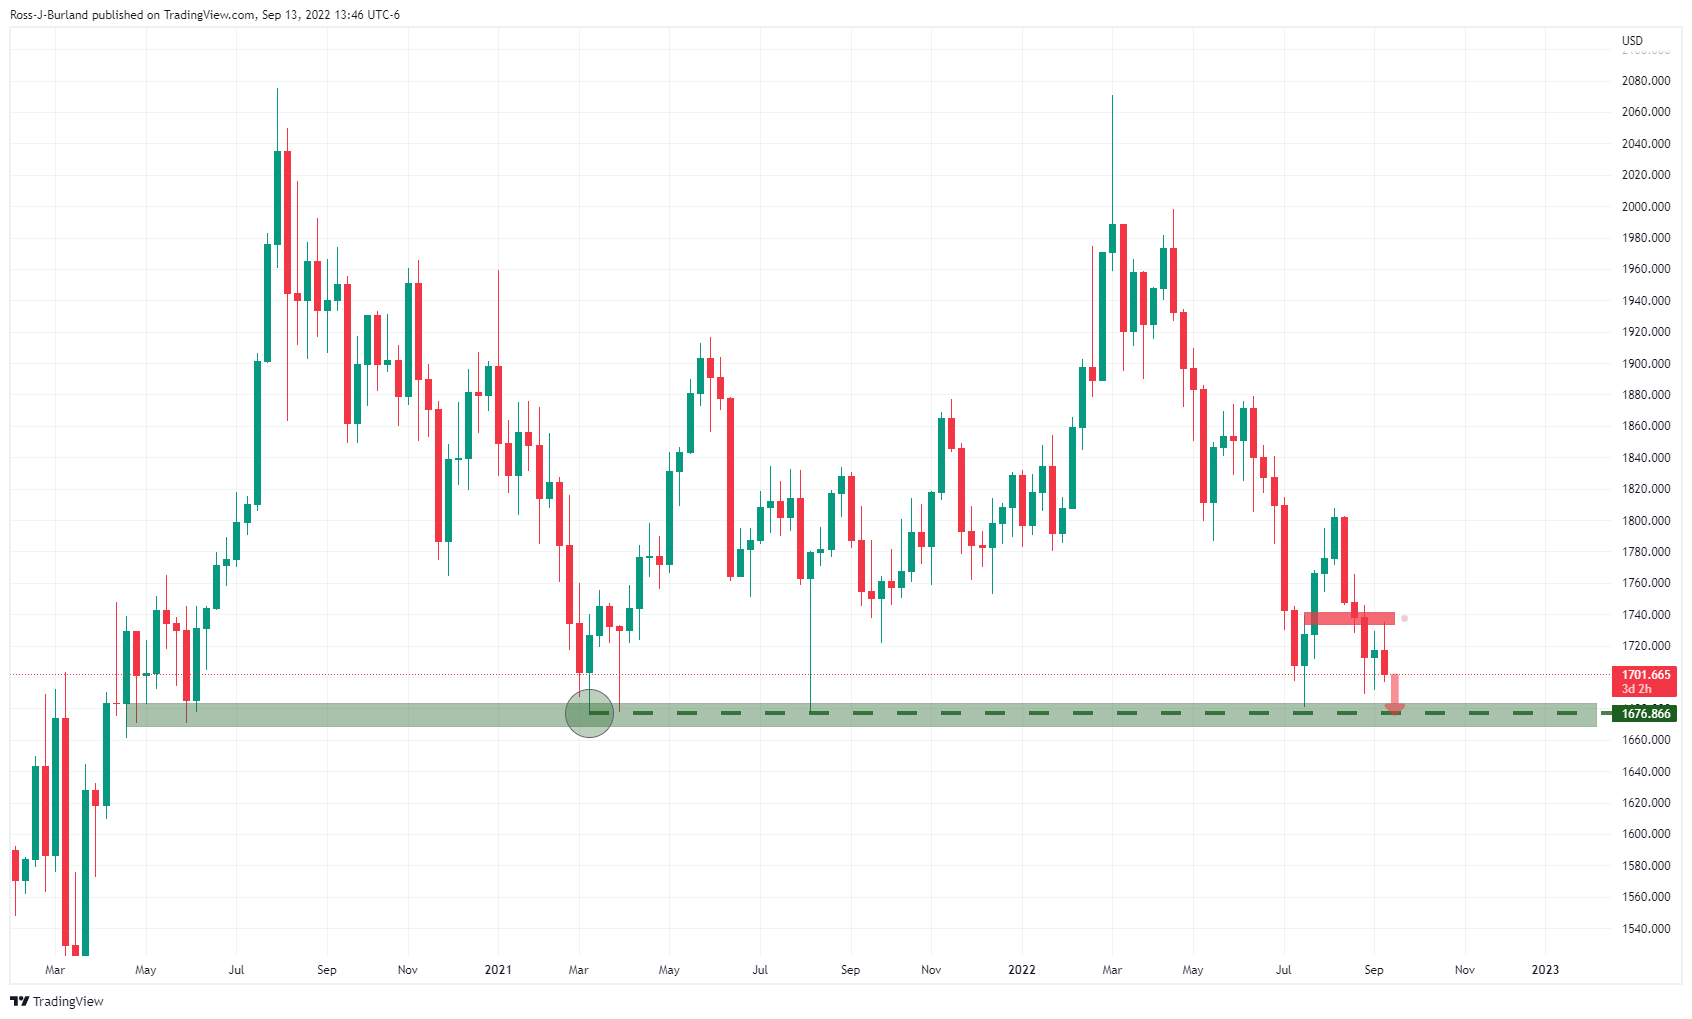
Source: Fx Street
With 6 years of experience, I bring to the table captivating and informative writing in the world news category. My expertise covers a range of industries, including tourism, technology, forex and stocks. From brief social media posts to in-depth articles, I am dedicated to creating compelling content for various platforms.


; see video")

