
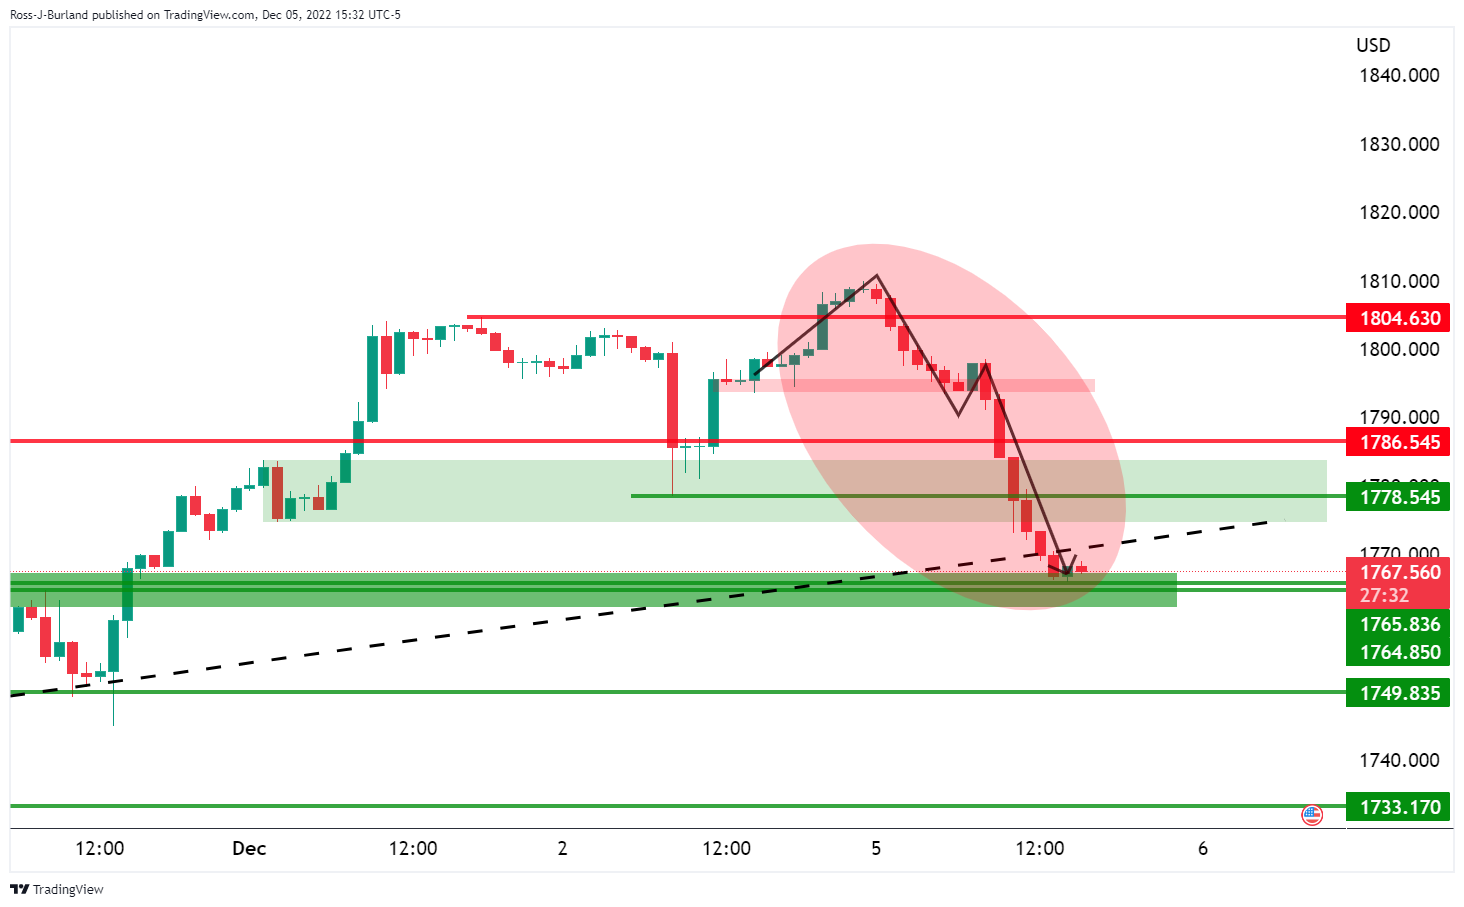
- Gold bears have charged and the price is now at a new support.
- Gold price is now on the back of the micro trend, testing the support of the neckline of the daily W formations.
- A bullish correction could occur with the objective of reaching $1,780.
Gold price crashed earlier in the week and is ending the North American session down 1.65%. The XAU/USD marked a minimum of $1,765.91 and it fell from a high of $1,810.01, in a move that was anticipated in this week’s pre-market analysis: Gold Chart of the Week: XAU/USD Bears Eye a Typical Correction Opportunity Below Critical Resistance
While there was a technical bias to the downside at the start of the week, fundamentals drove the move as investors feared that better-than-expected service sector activity could signal the Federal Reserve to hike interest rates. for longer.
US data changes course
The Institute for Supply Management (ISM) noted that its non-manufacturing PMI rose to 56.5 last month, up from 54.4 in October, indicating that the service sector, which accounts for more than two-thirds of US economic activity, continued to hold out against rising interest rates.
The data beat expectations that the non-manufacturing PMI would fall to 53.1. These data, combined with the surprising data for nonfarm payrolls and wage growth in November, as well as the news that consumer spending had accelerated in October, have increased optimism about the possibility of avoiding a recession in 2023.
The switch has flipped since the recently weaker Consumer Price Index, earlier ISM data and dovish comments from Federal Reserve Chairman Jerome Powell, which combined, had begun to weigh on the market price of the terminal rate that had decreased below 5%. The rate was seen at a high of 4.75%-5% ahead of the bullish data run.
However, based on futures contract prices and the CME Fed surveillance tool, the Fed is now seen as raising its interest rate, currently in the 3.75%-4% range, to 4.92%. in March of next year and, in all likelihood, up to the 5%-5.25% range in May. However, futures contracts linked to the Fed’s key interest rate still imply an 89% probability that the US central bank will raise interest rates by 50 basis points next week, to 4.25%-4.50%, and that the rates reach a maximum of 4.984% in May 2023.
However, US bond yields continue to rise which is bearish for gold as it offers no interest. The US 10-year bond yield last rose 3.4% to 3.605%. The Federal Open Market Committee (FOMC) meets on December 13 and 14.
Gold Technical Analysis
Previous analysis:
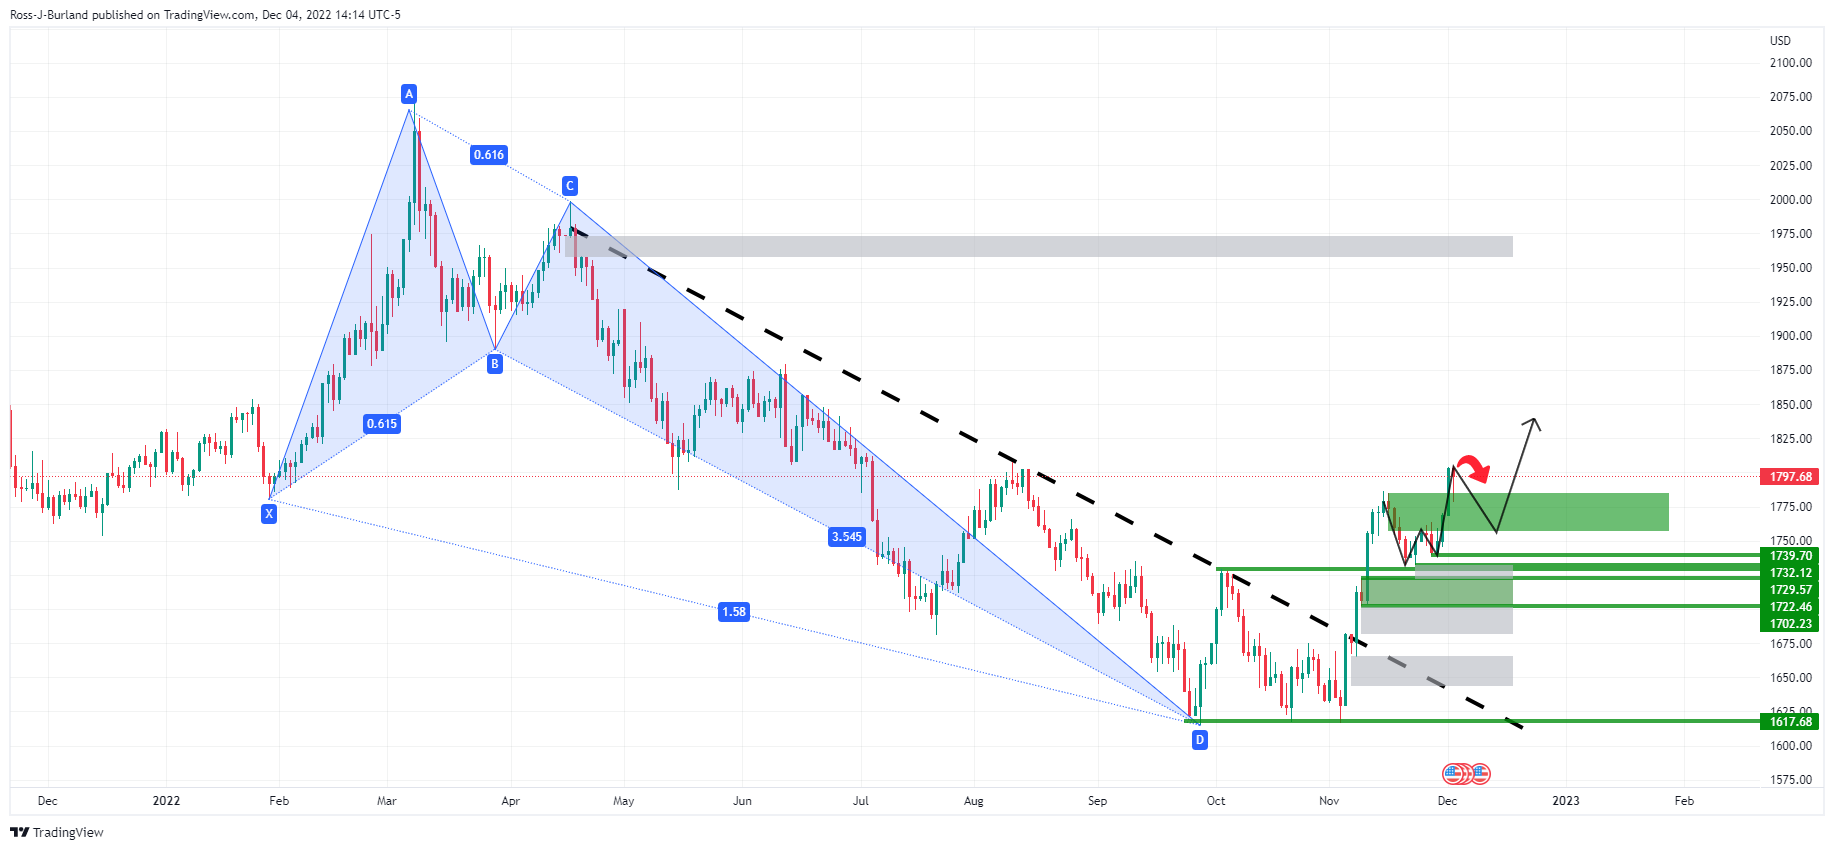
Based on this week’s pre-open analysis, the price was said to be at the back of the trend, which is generally bullish according to the harmonic pattern while above the lows of the W formation near $1,730.
Approaching…
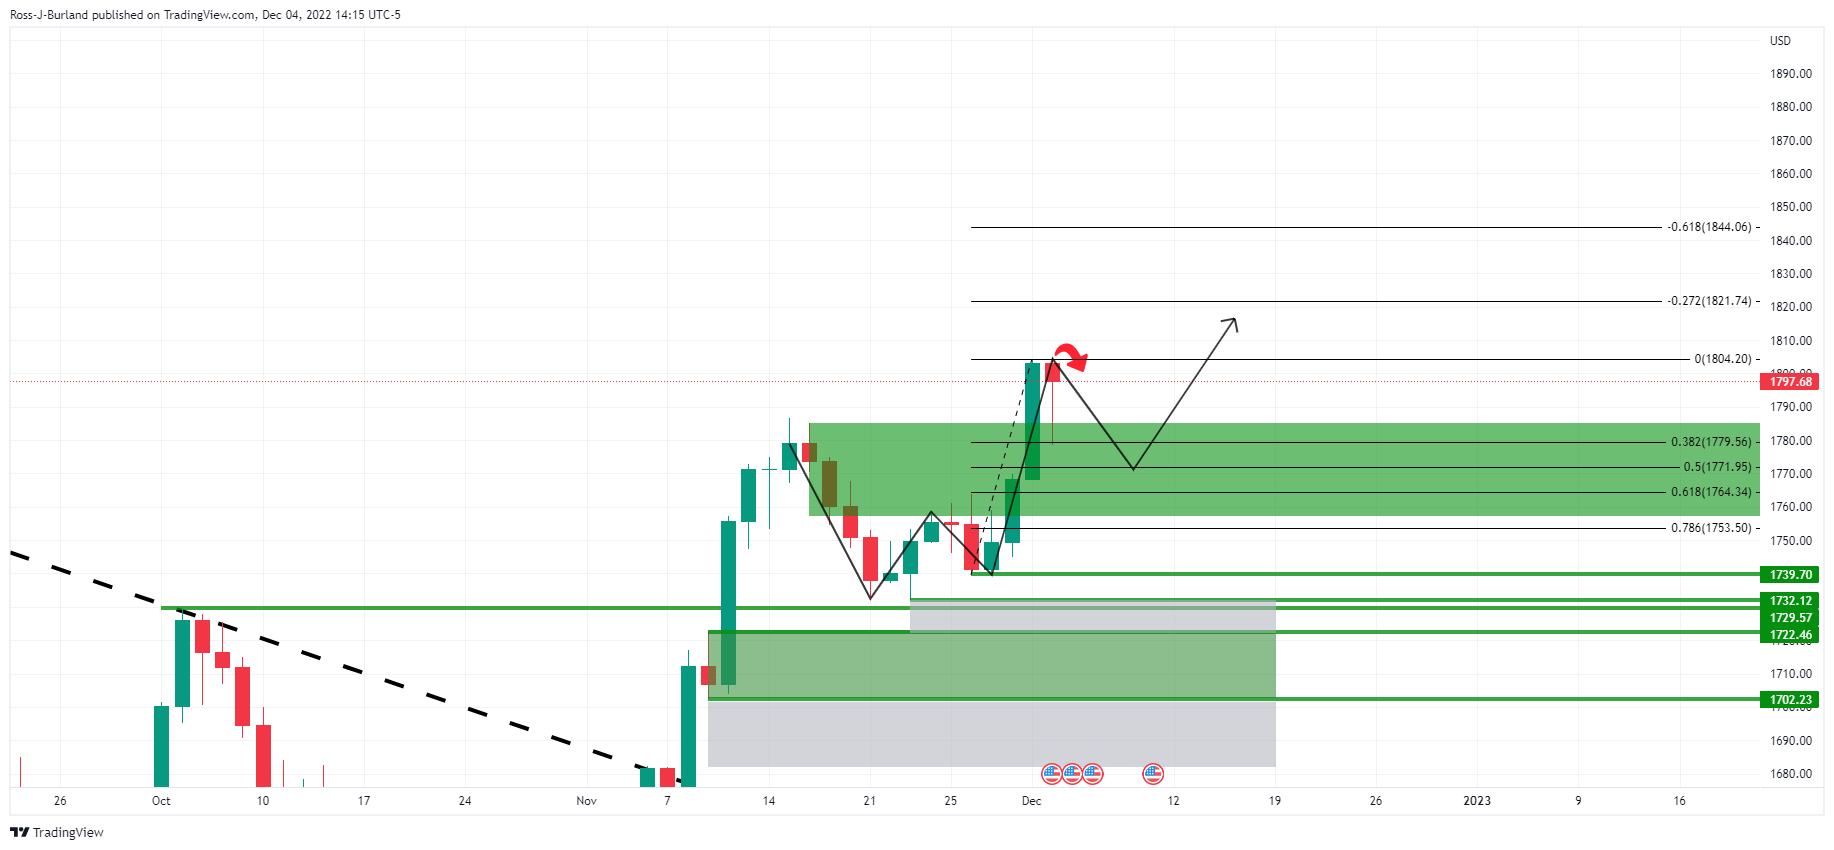
There were prospects for a correction towards the neckline of the W formation, as illustrated above and below, on the hourly chart:
With price potentially basing itself on $1,790 in the meantime, a test move to $1,800 is expected to “lure sellers back for the opening sessions with a move to trailing support found at 38.2%.” daily Fibonacci and a 50% mean reversal below that.”
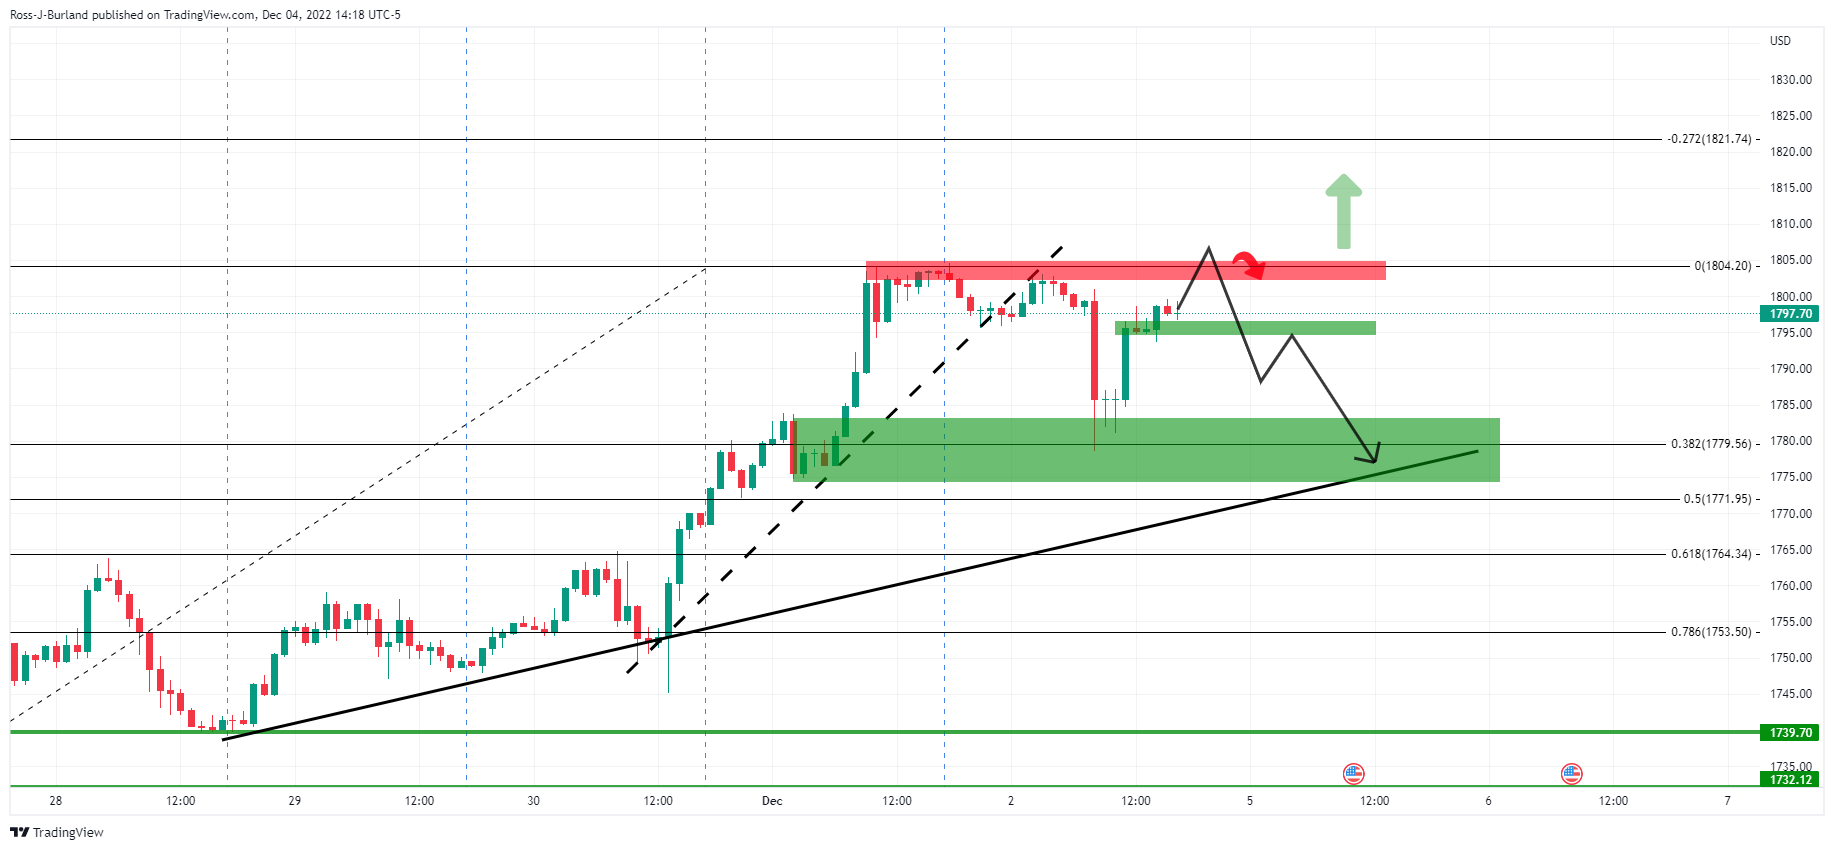
Gold Update:
Price action has followed the projection to the letter as illustrated above.
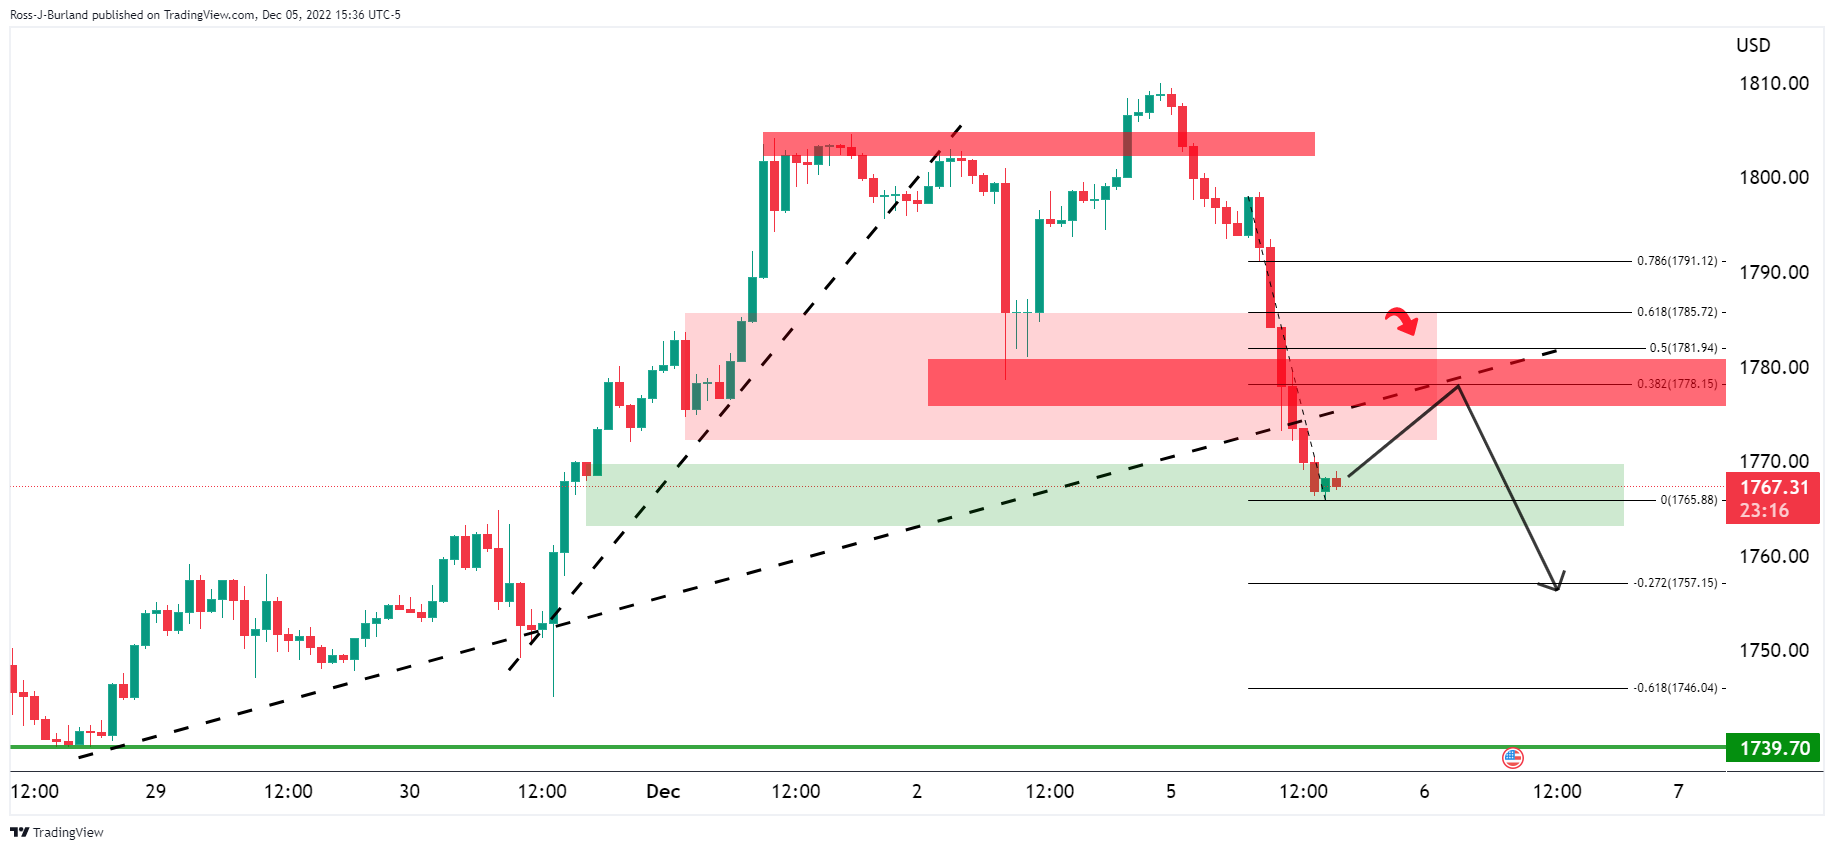
Although the price is now on the back of the microtrend, testing the daily support of the W formations, an upward correction could be in the offing with $1,780.
Source: Fx Street
I am Joshua Winder, a senior-level journalist and editor at World Stock Market. I specialize in covering news related to the stock market and economic trends. With more than 8 years of experience in this field, I have become an expert in financial reporting.


