
- Gold price breaks short-term resistance and targets $1,950, recording a three-day uptrend.
- Weakening US dollar and cautious market optimism underpin XAU/USD higher.
- US inflation figures and Fed talks seem to be key to a clear direction for the gold price.
Gold (XAU/USD) renews its intraday high and maintains Friday’s rise, despite a weak start to the week. Gold thus benefits from broad-based US dollar weakness, mainly due to softer US inflation expectations and mixed data from China. However, the Fed’s bullish stance and US-China tensions lead XAU/USD bulls to be cautious ahead of Wednesday’s US inflation numbers.
In addition, doubts about the latest US Treasury yields pose a challenge for gold buyers. It should be noted that markets’ fear of recession pushes traders towards traditional havens such as bonds, gold and the yen. . However, the same catalysts also allow the dollar to perk up sour sentiment, which it has not been able to of late. Consequently, mixed market concerns keep gold buyers hopeful, but room for the upside seems limited.
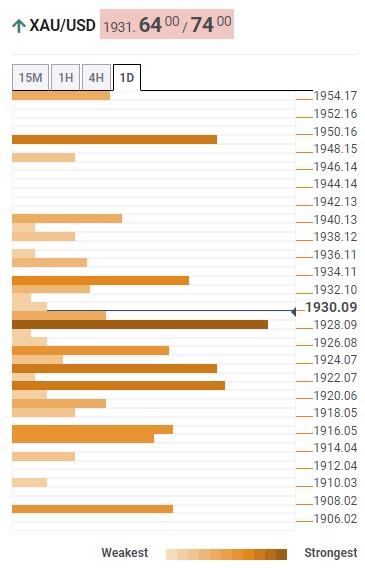
Gold Price: Key Levels to Watch
Our Technical Confluence Indicator shows that the price of Gold rises after crossing the key support of $1,930 comprising the Fibonacci 23.6% one-week, 38.2% Fibonacci one-month and the previous daily high.
With this, XAU/USD appears to be well on its way to reaching the $1,935 hurdle, which comprises the upper Bollinger band on the four-hour chart.
After that, the convergence of the 100 DMA and the 61.8% one month, around $1,950, will be in the spotlight.
Conversely, a break below $1,930 could quickly send gold price towards the confluence of supports at $1,922, including the 5 DMA, and the 38.2% 1-week and 1-month.
Should the price of Gold fall below $1,922, the 61.8% Fibonacci one week and the S1 Pivot Point one day will highlight the last defense of XAU/USD buyers around 1,915 $ before driving the price towards the round figure of $1,900.
Note that the one-day S2 and one-week S1 Pivot Points highlight the $1,908 level as a further filter to the south.
Gold: Key levels to watch
About the Technical Confluence Detector
The TCD (Technical Confluence Detector) is a tool to locate and indicate those price levels where there is a congestion of indicators, moving averages, Fibonacci levels, Pivot Points, etc. If you are a short-term trader, you will find entry points for counter-trend strategies and hunt a few points at a time. If you are a medium-long-term trader, this tool will allow you to know in advance the price levels at which a medium-long-term trend may stop and rest, where to unwind positions, or where to increase the size of your position.
Source: Fx Street
I am Joshua Winder, a senior-level journalist and editor at World Stock Market. I specialize in covering news related to the stock market and economic trends. With more than 8 years of experience in this field, I have become an expert in financial reporting.


