- Gold price rebounds, paring first daily loss in three days.
- Positive headlines for China and Hong Kong risk seem to favor the latest bounce in XAU/USD.
- Gold bears remain hopeful while dollar strength and Treasury yields keep recession fears on the table.
- Headlines surrounding Russia also poll buyers ahead of next week’s key Fed meeting.
Gold (XAU/USD) bounces from an intraday low to $1,785 in the early hours of Thursday as market traders lick their wounds after a negative start.
The latest easing of the risk aversion state, which initially helped the dollar post weekly gains, could be related to the headlines out of China. Recently, the Shanghai city authorities mentioned that as of this Friday they will stop demanding Covid controls from restaurants or entertainment venues. In the same vein, the South China Morning Post (SCMP) states that Hong Kong is going to “eaten isolation rules” for infected travelers, with a limit of 5 days.
Still, looming fears of an economic slowdown, as well as the threat of Russia’s use of nuclear weapons in its war with Ukraine, appear to be weighing on the XAU/USD. In addition, Bloomberg published a story suggesting increased tension between the US and China due to the latest bills that the US Congress is about to pass, which in turn challenges gold buyers. : “The US is poised to pass legislation revamping its Taiwan policy and restricting government use of Chinese semiconductors, moves that appear to antagonize Beijing even as President Joe Biden tries to ease tensions,” Bloomberg said .
Amid these rallies, S&P 500 futures reverse early losses as they recover from three-week lows to stand around 3,935 at press time. Elsewhere, 10-year US Treasury yields remain sluggish near 3.45%, paring previous day’s losses near the lowest levels seen since early September.
Looking ahead, the gold price may witness lackluster days before next week’s Federal Open Market Committee (FOMC) meeting. However, initial jobless claims will be released today, as well as preliminary data from the Michigan Consumer Sentiment Index and 5-Year Consumer Inflation Expectations.
Gold Price Technical Analysis
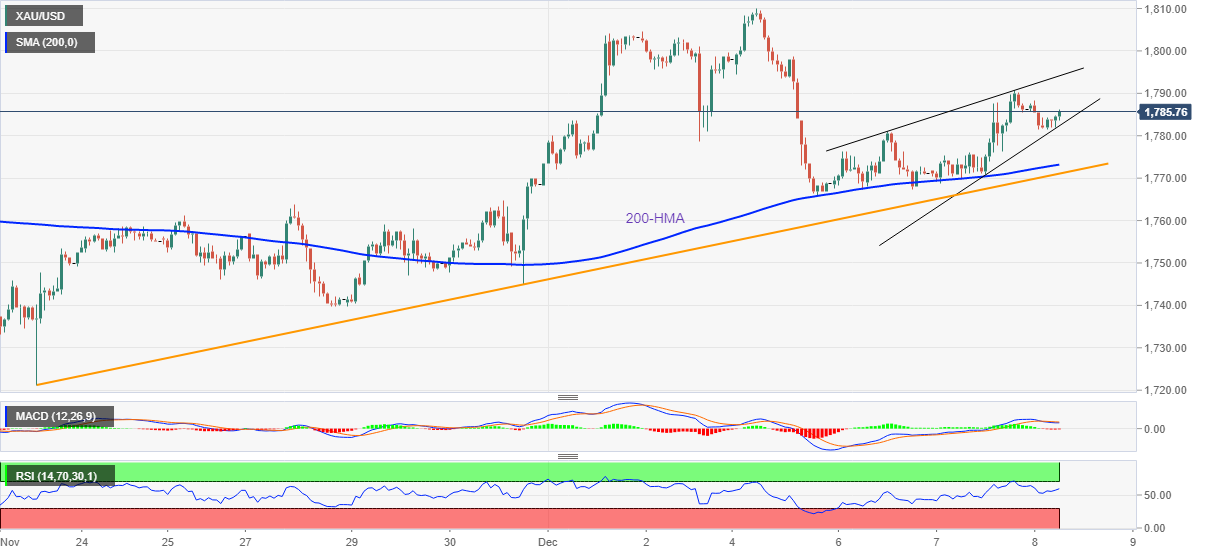
Gold price remains defensive above the 200 Hour Moving Average (HMA) level around $1,773. Thus, the yellow metal remains within a bearish immediate rising wedge pattern, currently between $1,782 and $1,795.
It should be noted that a rising trend line from two weeks ago is the key for bears to enter XAU/USD around $1,771 at the latest.
That being said, the bearish signals from the MACD and the recent firmness of the RSI keep sellers hopeful as the metal shows the rising wedge chart pattern on the hourly chart. However, a clear break above the $1,782 barrier will not hesitate to refresh the monthly high around $1,810.
Gold Price: Hourly Chart

Trend: Limited recovery expected
Gold Technical Levels
XAU/USD
| Panorama | |
|---|---|
| Last Price Today | 1785.63 |
| Today’s Daily Change | -1.47 |
| Today’s Daily Change % | -0.08 |
| Today’s Daily Open | 1787.1 |
| Trends | |
|---|---|
| 20 Daily SMA | 1764.3 |
| SMA of 50 Daily | 1705.76 |
| SMA of 100 Daily | 1716.62 |
| SMA of 200 Daily | 1793.65 |
| levels | |
|---|---|
| Previous Daily High | 1790.59 |
| Minimum Previous Daily | 1768.8 |
| Previous Weekly High | 1804.52 |
| Previous Weekly Minimum | 1739.72 |
| Maximum Prior Monthly | 1786.55 |
| Minimum Prior Monthly | 1616.69 |
| Daily Fibonacci 38.2% | 1782.27 |
| Daily Fibonacci 61.8% | 1777.12 |
| Daily Pivot Point S1 | 1773.74 |
| Daily Pivot Point S2 | 1760.37 |
| Daily Pivot Point S3 | 1751.95 |
| Daily Pivot Point R1 | 1795.53 |
| Daily Pivot Point R2 | 1803.95 |
| Daily Pivot Point R3 | 1817.32 |
Source: Fx Street
I am Joshua Winder, a senior-level journalist and editor at World Stock Market. I specialize in covering news related to the stock market and economic trends. With more than 8 years of experience in this field, I have become an expert in financial reporting.


