
- The price of gold resumed its bearish path on Monday, falling to the $1,980 area.
- The dollar is generally higher, buoyed by rising US yields.
The price of gold resumed declines on Monday, breaking below $1,990. He XAU/USD It bottomed out at $1,980, reaching the lowest level in a week.
At the time of writing, it is near $1,980, almost $60 off last week’s high. The reversal in gold gained momentum amid a rally in the US dollar and rising US yields.
Expectations that the Federal Reserve will raise interest rates again in May pushed yields higher. The 10-year US debt yield rose to 3.60%, the highest level since late March. The Dollar Index advances for the second consecutive day and exceeds 102.20 points.
Data released in the US on Monday showed a strong rebound for the Empire Manufacturing Index in April, to 10.8 from -24.60, beating expectations of -18.0. These figures contribute to expectations of a new rate hike by the Fed.
On the daily chart, the XAU/USD pair is trading around the 20-period SMA in the $1,990 area. If the yellow metal clearly consolidates below, the outlook would point to an extension of the correction. Conversely, if gold manages to hold above and retakes $2,005, the bulls could return. The next resistance is around $2,025.
XAU/USD daily chart
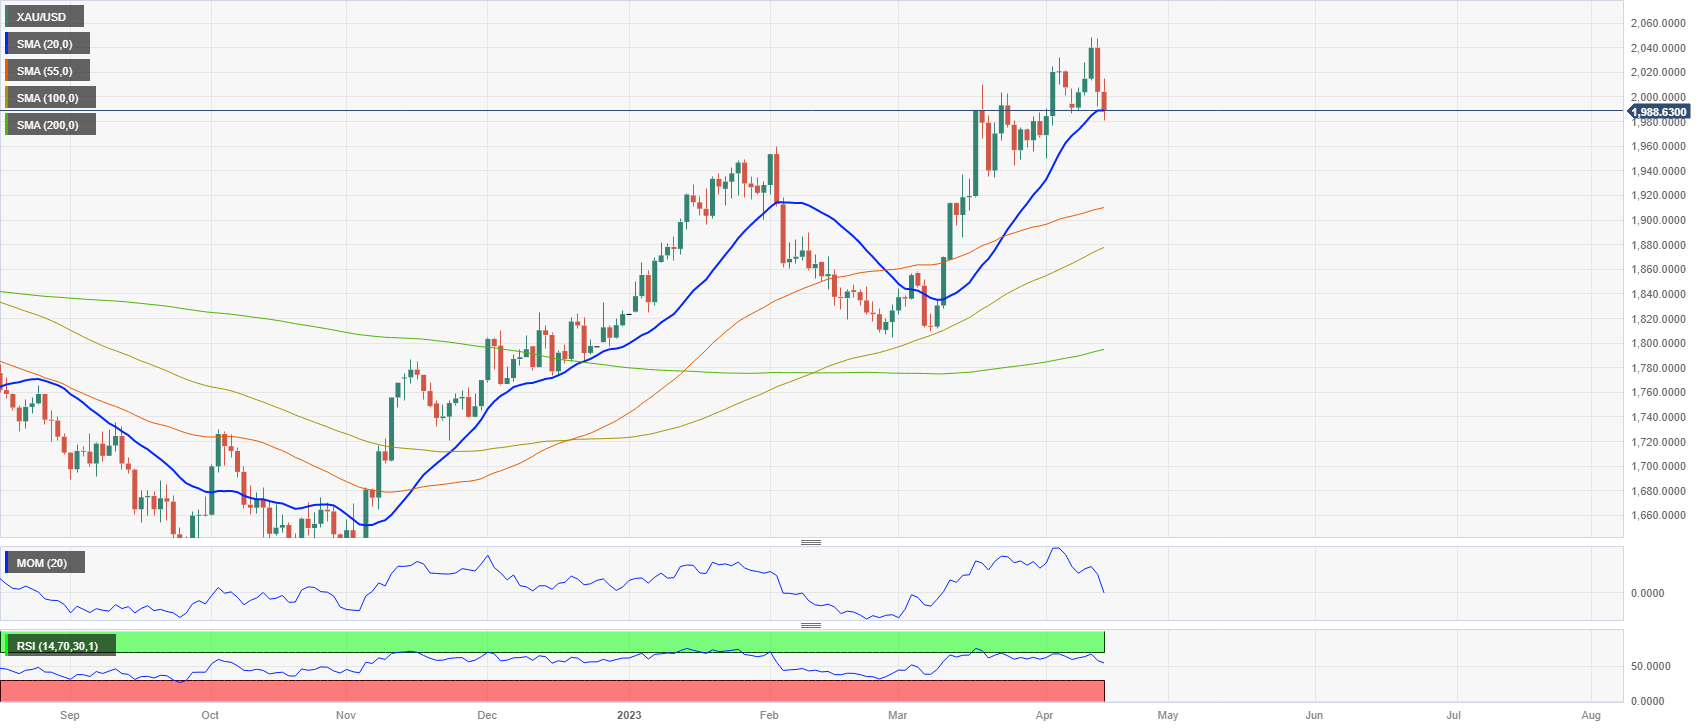
Source: Fx Street
I am Joshua Winder, a senior-level journalist and editor at World Stock Market. I specialize in covering news related to the stock market and economic trends. With more than 8 years of experience in this field, I have become an expert in financial reporting.


